- ImageCLEF 2024
- LifeCLEF 2024
- ImageCLEF 2023
- LifeCLEF 2023
- ImageCLEF 2022
- LifeCLEF2022
- ImageCLEF 2021
- LifeCLEF 2021
- ImageCLEF 2020
- LifeCLEF 2020
- ImageCLEF 2019
- LifeCLEF 2019
- ImageCLEF 2018
- LifeCLEF 2018
- ImageCLEF 2017
- LifeCLEF2017
- ImageCLEF 2016
- LifeCLEF 2016
- ImageCLEF 2015
- LifeCLEF 2015
- ImageCLEF 2014
- LifeCLEF 2014
- ImageCLEF 2013
- ImageCLEF 2012
- ImageCLEF 2011
- ImageCLEF 2010
- ImageCLEF 2009
- ImageCLEF 2008
- ImageCLEF 2007
- ImageCLEF 2006
- ImageCLEF 2005
- ImageCLEF 2004
- ImageCLEF 2003
- Publications
- Old resources
You are here
Subtask 2: concept retrieval
The queries for the concept-based retrieval task are based on an inspection of the query logs of a popular image search engine. We analyzed what people look for on the internet related to the concepts we defined for the photo annotation task in order to form a realistic yet challenging set of queries, see the figure below for an example.
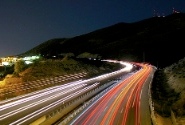
Images retrieved for the query 'find images containing light trails of traffic'.
Data format
The concept-based retrieval queries are provided in the XML format, where the first line contains the typical XML version header, the root node is <queries> and each query itself is a child of the root node. An example is as follows:
<query>
<number>14</number>
<title>traffic light trails</title>
<description>The user is looking for photos showing light trails made by traffic at night. The picture effectively is taken with a long
exposure time and thus the trails form straight or smoothly curving lines following the flow of traffic.</description>
<image>4bc87acb57e75469a5cbc7f3de1247b1</image>
<image>5b14d24c4e8747ade5e7a393e07f3dfe</image>
<image>6d5fda3c612a8d888bc969cdc7852ff</image>
</query>
where:
- The number uniquely refers to a particular query, where the queries are numbered starting at 0 and onwards.
- The title refers to what the user may possibly type as the query he would issue to an image search engine to find the images he has in mind.
- The description refers to what the user really is looking for and may contain one or more constraints indicating the kinds of images that will be considered correct and/or incorrect matches to the query.
- The query will be accompanied by three example images taken from the training set of the photo annotation task.
Submission format
The submission format follows the TREC format, so we can use their tools to evaluate your runs. For each query you may return up to 1000 relevant images, each representing a single line in your submission file and which should look as follows:
[query number] [placeholder] [image identifier] [retrieval rank] [retrieval score] [run identifier]
where:
- The query number refers to the query you are reporting the results on as above.
- The placeholder is necessary to conform to the TREC format, but is unused. Please always use the value 'IC12' here.
- The image identifier refers to the image you consider to be relevant to the query, where the identifiers are the filenames of images from the retrieval collection, e.g. 'im223647'.
- The retrieval rank refers a value between 0 and N-1, where N is the number of images you are reporting as relevant to the query. The rank indicates the position of the image within all the other relevant images, with 0 meaning the best position and N-1 meaning the worst position.
- The retrieval score refers to a floating-point value larger or equal to zero, where more relevance to the query should be expressed in a higher score.
- The run identifier is a tag that uniquely identifies yourself and the run. All lines within the same submission file should thus use the same tag, but should change between runs. Please change the identifier from year to year, since we may compare results across years and having the same name show up for both years is confusing. Make sure to use a tag that is a single alphanumerical string, so it should not contain any other characters than letters and digits.
- The elements are separated from each other by a single space.
In your submission file, you must process each query in order starting at number 0. Within a query the relevant images must be ordered by ascending retrieval ranks and descending retrieval scores. The retrieval rank and retrieval scores are inversely connected: the most relevant image to the query gets ranked at position 0 and assigned the highest score, whereas the least relevant image gets ranked at position N-1 and assigned the lowest score. Note that while ties in retrieval scores are possible they are not possible in retrieval ranks, so even when images are equally relevant a preference decision has to be made which image gets more highly ranked than the other. In the submission file the most straightforward approach is thus to order the images relevant to a query by their retrieval ranks.
You are allowed to submit up to 10 runs in total. When you submit a file you will be required to indicate which method you used for the run, i.e. whether the query formulation is done completely automatic or whether you required manual intervention to construct the query out of the query descriptions, e.g. by deriving a boolean connection of concepts (of course, after the query formulation step all runs should retrieve the images in an automated manner otherwise it would be cheating). Furthermore you will be required to indicate which features you used for the run, i.e. visual features only, textual features only or a combination of visual and textual features. The submission system will perform an automatic check to see if your submission file is correct. Finally, you will be asked to designate one of your runs as the primary run, where the images retrieved for this run will definitely contribute to the pooled relevance assessment, see below for more details.
Evaluation
We use a subset of the MIRFLICKR collection comprising of 200,000 photos. Due to this sheer quantity of images it is difficult to create a ground truth using human annotation and we will use 'pooling' instead. With pooling, we aggregate the top 100 results for all runs submitted by all teams for each of the topics and manually assess their relevance. We evaluate your runs and report on the results using the following evaluation measures:
Mean Average Precision (MAP)
This evaluation measure first ranks the images by their confidence scores, from high to low, for each query separately. The images are inspected one by one and each time a relevant image is encountered the precision and recall values are computed. In case of ties we consider all the images with the same confidence score together at once and produce only a single precision and recall value for them. We then interpolate the values so the recall measurements range from 0.0 to 1.0 with steps of 0.1; the precisions at these recall levels are obtained by taking the maximum precision obtained at any non-interpolated recall level equal or greater to the interpolated recall step level under consideration. To obtain the overall non-interpolated MAP (MnAP) value we average the non-interpolated precisions for each concept and then average these averages, whereas to obtain the overall interpolated MAP (MiAP) we instead average the average interpolated precisions over all concepts. Note that your primary focus should be on the non-interpolated MAP, which is the value we report below, although for completeness we report both the non-interpolated and interpolated MAP values in the detailed results.
Geometric Mean Average Precision (GMAP)
This evaluation measure is an extension to MAP. When comparing runs with each other the GMAP specifically highlights improvements obtained on relatively difficult queries, e.g. increasing the average precision of a query from 0.05 to 0.10 has a larger impact in its contribution to the GMAP than increasing the average precision from 0.25 to 0.30. To compute the non-interpolated GMAP (GMnAP) and the interpolated GMAP (GMiAP), we follow the same procedure as with MnAP and MiAP, but we instead average the logs of the average precision for each query, after which we exponentiate the resulting average back to obtain the GMAP. To avoid taking the log of an average precision of zero we add a very small epsilon value to each average precision before computing its log, which we remove again after exponentiating the averages of these logs; when the epsilon value is very small its effect on the final GMAP is negligible. Note that your primary focus should not be on any of the GMAP values, we nonetheless report both the non-interpolated and interpolated GMAP values in the detailed results.
AP@X
This evaluation measure reports the average precision obtained once a certain number of images has been encountered. We have computed the scores for values ranging from 10 to 100 in steps of 10, although your primary focus should be on AP@10, AP@20 and AP@100.
Results
In the table below we present the results for the runs, organized alphabetically by team name. You can download the detailed results here. For future reference you can download the Java-based evaluation code below; note that the code may not look as simple as MATLAB code that hides away many of the details, but it was written with legibility in mind. We will release the ground truth on the first day of the CLEF conference, so afterwards you will be able to apply the code to your own runs.
| IMU | MnAP | AP@10 | AP@20 | AP@100 | Features |
|---|---|---|---|---|---|
| 1340766842130__queryResult5 | 0.0045 | 0.0030 | 0.0064 | 0.0316 | Visual |
| 1341132445885__concept_retrieval_tag_title | 0.0802 | 0.0136 | 0.0376 | 0.1651 | Textual |
| 1341138130221__concept_retrieval_tag_image_all_three | 0.0763 | 0.0123 | 0.0320 | 0.1439 | Textual |
| 1341139568544__concept_retrieval_tag_image_first_not_null | 0.0711 | 0.0135 | 0.0241 | 0.1255 | Textual |
| 1341307125830__concept_retrieval_tag_title_and_image_all_3 | 0.0933 | 0.0187 | 0.0338 | 0.1715 | Textual |
| 1341307427683__concept_retrieval_wiki_expansion_tag_title | 0.0852 | 0.0187 | 0.0383 | 0.1721 | Textual |
| 1341307738212__concept_retrieval_wiki_expansion_tag_image_all_three | 0.0736 | 0.0119 | 0.0212 | 0.1414 | Textual |
| 1341307943409__concept_retrieval_wiki_expansion_tag_image_first_not_null | 0.0786 | 0.0133 | 0.0260 | 0.1311 | Textual |
| 1341308240737__concept_retrieval_no_expansion_tag_title_and_image_all_3 | 0.0852 | 0.0137 | 0.0262 | 0.1635 | Textual |
| 1341315859174__concept_retrieval_wiki_expansion_tag_combine_title_and_all_three_at_result_level | 0.0799 | 0.0141 | 0.0372 | 0.1638 | Textual |
| KIDS NUTN | MnAP | AP@10 | AP@20 | AP@100 | Features |
|---|---|---|---|---|---|
| 1341041913038__KIDS_task2_result1 | 0.0009 | 0.0003 | 0.0010 | 0.0096 | Multimodal |
| 1341042372681__KIDS_task2_semi | 0.0007 | 0.0006 | 0.0014 | 0.0081 | Multimodal |
| 1341333937735__kids_subtask2_rank | 0.0313 | 0.0051 | 0.0077 | 0.0729 | Multimodal |
| MLKD | MnAP | AP@10 | AP@20 | AP@100 | Features |
|---|---|---|---|---|---|
| 1340920299835__QBTE | 0.0487 | 0.0105 | 0.0220 | 0.1186 | Textual |
| 1340920373813__images2012_tagsC2R0.6SCMpowerFCSproduct | 0.0534 | 0.0111 | 0.0222 | 0.1335 | Textual |
| 1340920420914__images2012_visualC2R0.6SCMpowerFCSproduct | 0.0244 | 0.0098 | 0.0176 | 0.0751 | Visual |
| 1340920479060__images2012_multi_bestC2R0.6SCMpowerFCSproduct | 0.0501 | 0.0109 | 0.0209 | 0.1297 | Multimodal |
| 1340920563872__images2012_multi_avgC2R0.6SCMpowerFCSproduct | 0.0607 | 0.0164 | 0.0316 | 0.1393 | Multimodal |
| 1340920605758__images2012_multi_avgC3R0.3SCMpowerFCSproduct | 0.0665 | 0.0181 | 0.0342 | 0.1497 | Multimodal |
| 1340920652451__images2012_multi_avgC4R0.2SCMpowerFCSproduct | 0.0702 | 0.0214 | 0.0342 | 0.1495 | Multimodal |
| 1340920766416__images2012_multi_avgC2R0.6SCMpowerFCSmax | 0.0540 | 0.0145 | 0.0286 | 0.1343 | Multimodal |
| 1340920826876__images2012_multi_avgC3R0.3SCMpowerFCSmax | 0.0572 | 0.0148 | 0.0306 | 0.1442 | Multimodal |
| 1340920878624__images2012_multi_avgC4R0.2SCMpowerFCSmax | 0.0635 | 0.0176 | 0.0322 | 0.1502 | Multimodal |
| MSATL | MnAP | AP@10 | AP@20 | AP@100 | Features |
|---|---|---|---|---|---|
| 1341231850761__retrieval-1-final-textual-byTitle+ConceptNames | 0.0138 | 0.0044 | 0.0077 | 0.0547 | Textual |
| 1341231912263__retrieval-2-final-textual-byTitle+ConceptKeywords-K=15 | 0.0070 | 0.0015 | 0.0059 | 0.0330 | Textual |
| 1341231940969__retrieval-3-final-textual-byTitle+ConceptKeywords-K=15+Description | 0.0118 | 0.0032 | 0.0076 | 0.0445 | Textual |
| ReDCAD | MnAP | AP@10 | AP@20 | AP@100 | Features |
|---|---|---|---|---|---|
| 1341138375297__LDA01tx | 0.0129 | 0.0003 | 0.0042 | 0.0475 | Textual |
| REGIM | MnAP | AP@10 | AP@20 | AP@100 | Features |
|---|---|---|---|---|---|
| 1341254388218__run1 | 0.0014 | 0.0010 | 0.0020 | 0.0130 | Multimodal |
| 1341255660919__run2 | 0.0020 | 0.0005 | 0.0019 | 0.0154 | Multimodal |
| 1341255987225__run3 | 0.0020 | 0.0003 | 0.0020 | 0.0151 | Multimodal |
| 1341256230596__run4 | 0.0013 | 0.0010 | 0.0020 | 0.0135 | Multimodal |
| 1341256608855__run5 | 0.0025 | 0.0011 | 0.0025 | 0.0164 | Textual |
| 1341256737967__run6 | 0.0021 | 0.0007 | 0.0014 | 0.0143 | Textual |
| 1341256981053__run7 | 0.0020 | 0.0006 | 0.0010 | 0.0140 | Textual |
| 1341257048261__run8 | 0.0025 | 0.0009 | 0.0024 | 0.0169 | Textual |
| 1341257166004__run9 | 0.0029 | 0.0022 | 0.0038 | 0.0160 | Visual |
| 1341257233685__run10 | 0.0031 | 0.0022 | 0.0039 | 0.0164 | Visual |
| UNED | MnAP | AP@10 | AP@20 | AP@100 | Features |
|---|---|---|---|---|---|
| 1340771399064__UNED_UV_01_TXT_AUTO_EN | 0.0208 | 0.0032 | 0.0021 | 0.0653 | Textual |
| 1340771984063__UNED_UV_02_TXT_AUTO_EN | 0.0250 | 0.0004 | 0.0019 | 0.0729 | Textual |
| 1340857585993__UNED_UV_03_IMG_BASE2_LFCF_2VECT_TXT_AUTO_EN_BASE_TXTIMG | 0.0271 | 0.0125 | 0.0203 | 0.0813 | Multimodal |
| 1340858227346__UNED_UV_04_IMG_BASE2_LFCF_1VECT_TXT_AUTO_EN_BASE_TXTIMG | 0.0271 | 0.0131 | 0.0199 | 0.0837 | Multimodal |
| 1340858446352__UNED_UV_05_IMG_BASE2_LFCF_2VECT_TXT_AUTO_EN_EXPAND_TXTIMG | 0.0260 | 0.0121 | 0.0224 | 0.0807 | Multimodal |
| 1340858750359__UNED_UV_06_IMG_BASE2_LFCF_1VECT_TXT_AUTO_EXPAND_TXTIMG | 0.0286 | 0.0116 | 0.0223 | 0.0819 | Multimodal |
| 1340859063651__UNED_UV_07_IMG_BASE3_LFCF_2VECT_TXT_AUTO_EN_BASE_TXTIMG | 0.0275 | 0.0112 | 0.0203 | 0.0859 | Multimodal |
| 1340859419559__UNED_UV_09_IMG_BASE3_LFCF_2VECT_TXT_AUTO_EN_EXPAND_TXTIMG | 0.0270 | 0.0104 | 0.0217 | 0.0822 | Multimodal |
| 1340859615007__UNED_UV_10_IMG_BASE3_LFCF_1VECT_TXT_AUTO_EN_EXPAND_TXTIMG | 0.0295 | 0.0125 | 0.0206 | 0.0848 | Multimodal |
| 1340860899803__UNED_UV_08_IMG_BASE3_LFCF_1VECT_TXT_AUTO_EN_BASE_TXTIMG | 0.0275 | 0.0122 | 0.0198 | 0.0854 | Multimodal |
| Attachment | Size |
|---|---|
| 16.83 KB | |
| 3.23 KB | |
| 16.66 KB | |
| 4.34 KB | |
| 1.1 KB | |
| 9.59 KB | |
| 15.16 KB | |
| 9.47 KB |