- ImageCLEF 2024
- LifeCLEF 2024
- ImageCLEF 2023
- LifeCLEF 2023
- ImageCLEF 2022
- LifeCLEF2022
- ImageCLEF 2021
- LifeCLEF 2021
- ImageCLEF 2020
- LifeCLEF 2020
- ImageCLEF 2019
- LifeCLEF 2019
- ImageCLEF 2018
- LifeCLEF 2018
- ImageCLEF 2017
- LifeCLEF2017
- ImageCLEF 2016
- LifeCLEF 2016
- ImageCLEF 2015
- LifeCLEF 2015
- ImageCLEF 2014
- LifeCLEF 2014
- ImageCLEF 2013
- ImageCLEF 2012
- ImageCLEF 2011
- ImageCLEF 2010
- ImageCLEF 2009
- ImageCLEF 2008
- ImageCLEF 2007
- ImageCLEF 2006
- ImageCLEF 2005
- ImageCLEF 2004
- ImageCLEF 2003
- Publications
- Old resources
You are here
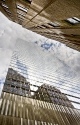
Subtask 1: concept annotation
In the concept annotation task your goal is to detect the presence of the various concepts in the images and provide us with the annotations on an per-image basis, see the figure below for an example.

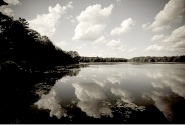
Images annotated with the concept 'reflection'.
Data format
We can distinguish between the 'concept' files, where each file refers to a single concept in which its presence or absence in the images is indicated, and the 'annotation' files, where each file refers to a single image in which the presence or absence of the concepts is indicated.
Concept files: clean version
The clean version of the concept files only lists the image identifiers for which the human annotators decided by majority vote the concept was present. The format of a file referring to a particular concept is as follows:
[image identifier a]
[image identifier b]
[image identifier c]
...
[image identifier z]
Concept files: raw version
The raw version of the concept files lists for every image several judgments given by human annotators on whether or not the concept was present. The format of a file referring to a particular concept is as follows:
[image identifier 0] [judgment] [judgment] ... [judgment]
[image identifier 1] [judgment] [judgment] ... [judgment]
...
[image identifier N-1] [judgment] [judgment] ... [judgment]
where each line contains an image identifier and at least three judgments, each of which can be either 0, indicating a particular annotator did not believe the concept was present, or 1, indicating the annotator believed the concept was present; the elements on a single line are separated from each other by a single space.
Annotation files: clean version
The clean version of the annotation files only lists the concepts for which the human annotators decided by majority vote it was present in the image. The format of a file referring to a particular image is as follows:
[concept a]
[concept b]
[concept c]
...
[concept z]
Annotation files: raw version
The raw version of the annotation files lists for each concept the agreement between the judgments of the human annotators whether or not it was present in the image. The format of a file referring to a particular image is as follows:
[concept 0] [agreement]
[concept 1] [agreement]
[concept 2] [agreement]
...
[concept N-1] [agreement]
where each line contains the name of a concept and the average agreement on the presence of a concept, where both elements are separated by a single space.
Be aware that there is no guarantee that the concepts are 100% correct. Even though the concepts have been annotated by multiple persons, there is a lot of room for personal interpretation and thus subjectivity. Some concepts are relatively easy to detect, e.g. 'sun', 'cat', whereas others are more difficult, e.g. 'partial blur', 'active', so make sure your algorithm is flexible enough to handle different levels of annotation quality.
Submission format
The submission format to indicate which concepts are present in an image is similar to the format above. Each image in the test collection is to be represented by a single line in your submission file, which should look as follows:
[image identifier] [confidence score for concept 0] [binary score for concept 0] ... [confidence score for concept N-1] [binary score for concept N-1]
where:
- The image identifier refers to the filename of the image as above.
- The confidence score refers to a floating-point value between 0 and 1 that indicates how confident your algorithm is in the presence of the concept in the image, where a higher value denotes a higher confidence.
- The binary score refers to a value of either 0 or 1 that indicates the final decision of your algorithm on the presence of the concept in the image, with 0 meaning the absence of the concept and 1 meaning the presence of the concept.
- The elements are separated from each other by a single space.
We call each submission a 'run'. When you submit a file you will be required to indicate which features you used for the run, i.e. visual features only, textual features only or a combination of visual and textual features. You are allowed to submit up to five runs in total. The submission system will perform an automatic check to see if your submission file is correct.
Evaluation
To determine the quality of your annotations we will apply three different measures:
Mean Average Precision (MAP)
This evaluation measure first ranks the images by their confidence scores, from high to low, for each concept separately. The images are inspected one by one and each time a relevant image is encountered the precision and recall values are computed. In case of ties we consider all the images with the same confidence score together at once and produce only a single precision and recall value for them. We then interpolate the values so the recall measurements range from 0.0 to 1.0 with steps of 0.1; the precisions at these recall levels are obtained by taking the maximum precision obtained at any non-interpolated recall level equal or greater to the interpolated recall step level under consideration. To obtain the overall non-interpolated MAP (MnAP) value we average the non-interpolated precisions for each concept and then average these averages, whereas to obtain the overall interpolated MAP (MiAP) we instead average the average interpolated precisions over all concepts. Note that your primary focus should be on the interpolated MAP, which is the value we report below, although for completeness we report both the non-interpolated and interpolated MAP values in the detailed results.
Geometric Mean Average Precision (GMAP)
This evaluation measure is an extension to MAP. When comparing runs with each other the GMAP specifically highlights improvements obtained on relatively difficult concepts, e.g. increasing the average precision of a concept from 0.05 to 0.10 has a larger impact in its contribution to the GMAP than increasing the average precision from 0.25 to 0.30. To compute the non-interpolated GMAP (GMnAP) and the interpolated GMAP (GMiAP), we follow the same procedure as with MnAP and MiAP, but we instead average the logs of the average precision for each concept, after which we exponentiate the resulting average back to obtain the GMAP. To avoid taking the log of an average precision of zero we add a very small epsilon value to each average precision before computing its log, which we remove again after exponentiating the averages of these logs; when the epsilon value is very small its effect on the final GMAP is negligible. Note that your primary focus should be on the interpolated GMAP, which is the value we report below, although for completeness we report both the non-interpolated and interpolated GMAP values in the detailed results.
F1
The F1-measure uses the provided binary scores to determine how well the annotations are. We have computed the instance-averaged, micro-averaged and macro-averaged F1 scores for the photos as well as for the concepts. The instance-F1 for the photos is computed by determining the number of true positives, false positives, true negatives and false negatives in terms of detected concepts and using this to compute the F1-score for each invididual photo, after which the F1-scores are averaged over all photos. The micro-F1 for the photos is computed by averaging the precision and recall scores for each individual photo and then computing the F1-score from these averages. The macro-F1 for the photos is computed by aggregating the number of true positives, false positives, true negatives and false negatives over all photos and then computing the F1-score based on these numbers. The micro-F1 and macro-F1 for the concepts is computed in a similar fashion, swapping the roles of the photos and concepts. Note that your primary focus should be on the photo-based micro-F1, which is the value we report below, although for completeness we report all instance-F1 and macro-F1 values in the detailed results.
Results
In the table below we present the results for the runs, organized alphabetically by team name. We have evaluated the quality of your annotations on all concepts combined, as well as for the different concept categories. You can download the detailed results at the bottom of this page. For future reference you can download the Java-based evaluation code below; note that the code may not look as simple as MATLAB code that hides away many of the details, but it was written with legibility in mind. We will release the ground truth on the first day of the CLEF conference, so afterwards you will be able to apply the code to your own runs.
| BUAA AUDR | MiAP | GMiAP | F-ex | Features |
|---|---|---|---|---|
| 1341023263573__AUDR_Photoannotation_result1_sift_200_softQuantile_Svm_visualFeatureOnly | 0.1423 | 0.0818 | 0.2167 | Visual |
| 1341063910124__AUDR_Photoannotation_result2_textOnly | 0.0723 | 0.0320 | 0.0209 | Textual |
| 1341070659023__AUDR_Photoannotation_result3_textAndVisual | 0.1307 | 0.0558 | 0.2592 | Multimodal |
| CEA LIST | MiAP | GMiAP | F-ex | Features |
|---|---|---|---|---|
| 1340892526368__multimedia_visualcsift_tagflickr_tagwordnet | 0.4159 | 0.3615 | 0.5404 | Multimodal |
| 1340892584587__textual_tagflickr_tagwordnet | 0.3314 | 0.2698 | 0.4452 | Textual |
| 1340892630317__multimedia_visualrootsift_tagflickr_tagwordnet | 0.4086 | 0.3472 | 0.5374 | Multimodal |
| 1340892682486__multimedia_bomw | 0.4084 | 0.3487 | 0.5295 | Multimodal |
| CERTH | MiAP | GMiAP | F-ex | Features |
|---|---|---|---|---|
| 1340992633395__final_prediction_textual | 0.2311 | 0.1669 | 0.3946 | Textual |
| 1340993620758__final_prediction_visual | 0.2628 | 0.1904 | 0.4838 | Visual |
| 1340993764133__final_prediction_all | 0.3210 | 0.2547 | 0.4899 | Multimodal |
| 1341055581582__gp_run_final_1 | 0.2887 | 0.2314 | 0.2234 | Multimodal |
| 1341071165550__final_prediction_l | 0.3012 | 0.2286 | 0.4950 | Multimodal |
| DBRIS | MiAP | GMiAP | F-ex | Features |
|---|---|---|---|---|
| 1341345555412__DBRIS1 | 0.0927 | 0.0441 | 0.0973 | Visual |
| 1341345723239__DBRIS2 | 0.0938 | 0.0454 | 0.0752 | Visual |
| 1341345360379__DBRIS3 | 0.0925 | 0.0445 | 0.0998 | Visual |
| 1341345864189__DBRIS4 | 0.0976 | 0.0476 | 0.1006 | Visual |
| 1341345998705__DBRIS5 | 0.0972 | 0.0470 | 0.1070 | Visual |
| DMS-SZTAKI | MiAP | GMiAP | F-ex | Features |
|---|---|---|---|---|
| 1341323222049__jchfr15k | 0.4258 | 0.3676 | 0.5731 | Multimodal |
| 1341324363582__jch10ksep | 0.4003 | 0.3445 | 0.5535 | Multimodal |
| 1341326138352__jchb10ksep | 0.3972 | 0.3386 | 0.5533 | Multimodal |
| 1341332281453__jchaggsep | 0.4212 | 0.3655 | 0.5724 | Multimodal |
| 1341332329608__jchbicwelf | 0.4173 | 0.3611 | 0.5717 | Multimodal |
| IMU | MiAP | GMiAP | F-ex | Features |
|---|---|---|---|---|
| 1340180988512__result_new_300_7 | 0.0819 | 0.0387 | 0.0429 | Visual |
| 1341057511120__tag_wiki_expansion_max_postProb | 0.2368 | 0.1825 | 0.4685 | Textual |
| 1341058520826__tag_inex_expansion_training_testing_max_postProb | 0.2174 | 0.1665 | 0.4535 | Textual |
| 1341060050739__tag_max_postProb | 0.2241 | 0.1698 | 0.4128 | Textual |
| 1341098490654__tag_wiki_expansion_training_testing_normalized_0-1 | 0.2441 | 0.1917 | 0.4535 | Textual |
| IL | MiAP | GMiAP | F-ex | Features |
|---|---|---|---|---|
| 1340039987845__submission | 0.1521 | 0.0894 | 0.3532 | Textual |
| 1340824468570__submission | 0.1724 | 0.1140 | 0.3389 | Textual |
| ISI | MiAP | GMiAP | F-ex | Features |
|---|---|---|---|---|
| 1342439831472__result_SIFTLBP | 0.3243 | 0.2590 | 0.5451 | Visual |
| 1342439923209__result_SIFTLBPtf | 0.4046 | 0.3436 | 0.5559 | Multimodal |
| 1342440163722__result_SIFTLBPcSIFTtf | 0.4136 | 0.3540 | 0.5583 | Multimodal |
| 1342440273401__result_SIFTLBPcSIFTtf_tfidf | 0.4131 | 0.3580 | 0.5597 | Multimodal |
| 1342529215789__result_SIFTLBPtf_tfidf | 0.4029 | 0.3462 | 0.5574 | Multimodal |
| KIDS NUTN | MiAP | GMiAP | F-ex | Features |
|---|---|---|---|---|
| 1341025732325__result(Weight)-10000 | 0.0947 | 0.0495 | 0.3505 | Multimodal |
| 1341025924275__result(NoWeight)-10000 | 0.0985 | 0.0537 | 0.3478 | Multimodal |
| 1341026222425__KIDS_semi_flickr | 0.1018 | 0.0472 | 0.3149 | Multimodal |
| 1341026490143__KIDS_high_precision_result_flickr | 0.1022 | 0.0470 | 0.3662 | Multimodal |
| 1341307398571__kids_result_flickr_2 | 0.1717 | 0.0984 | 0.4406 | Multimodal |
| LIRIS | MiAP | GMiAP | F-ex | Features |
|---|---|---|---|---|
| 1340989148486__1_text_model | 0.3328 | 0.2771 | 0.3917 | Textual |
| 1340989148487__2_text_model | 0.3338 | 0.2759 | 0.4691 | Textual |
| 1341063302096__3_visual_model_New | 0.3481 | 0.2858 | 0.5437 | Visual |
| 1341063410100__4_multi_model | 0.4366 | 0.3875 | 0.5763 | Multimodal |
| 1341019255800__5_multi_model | 0.4367 | 0.3877 | 0.5766 | Multimodal |
| MLKD | MiAP | GMiAP | F-ex | Features |
|---|---|---|---|---|
| 1340892940373__1-textual | 0.0744 | 0.0327 | 0.3951 | Textual |
| 1340893147700__2-visual | 0.3185 | 0.2567 | 0.5534 | Visual |
| 1340893262024__3-multimodal1 | 0.2933 | 0.2337 | 0.5045 | Multimodal |
| 1340893445802__4-multimodal2 | 0.3118 | 0.2516 | 0.5285 | Multimodal |
| 1340893604449__5-multimodal3 | 0.2065 | 0.0814 | 0.5253 | Multimodal |
| MSATL | MiAP | GMiAP | F-ex | Features |
|---|---|---|---|---|
| 1340905852212__annotations-1-visual | 0.0868 | 0.0414 | 0.1069 | Visual |
| 1341055512433__annotations-2-final-textual-byConcept | 0.2209 | 0.1653 | 0.2093 | Textual |
| 1341055594867__annotations-3-final-textual-byKeywords-k=15 | 0.2086 | 0.1534 | 0.2635 | Textual |
| 1341055678417__annotations-4-final-visual+textual-byConcept-BestMerged | 0.0867 | 0.0408 | 0.0277 | Multimodal |
| 1341055785851__annotations-5-final-visual+textual-byKeywords-k=15-BestMerged | 0.0842 | 0.0397 | 0.0319 | Multimodal |
| NII | MiAP | GMiAP | F-ex | Features |
|---|---|---|---|---|
| 1341125654162__NII.Run1.KSC.Loc45-G8 | 0.3306 | 0.2694 | 0.5566 | Visual |
| 1341125997092__NII.Run2.KSC.Loc36-G8 | 0.3318 | 0.2703 | 0.5549 | Visual |
| 1341126361701__NII.Run3.KSC.Loc45 | 0.3265 | 0.2650 | 0.5600 | Visual |
| 1341126879290__NII.Run4.KSC.Loc36 | 0.3264 | 0.2645 | 0.5588 | Visual |
| 1341127140704__NII.Run5.KSC.LocDenseSIFT30 | 0.3174 | 0.2525 | 0.5572 | Visual |
| NPDILIP6 | MiAP | GMiAP | F-ex | Features |
|---|---|---|---|---|
| 1341070721262__result_4KBN_384FV_a10b1 | 0.3437 | 0.2815 | 0.4199 | Visual |
| 1341070953984__result_4KBN_384FV_a20b1 | 0.3356 | 0.2775 | 0.3786 | Visual |
| 1341348153832__result_4KBN_a10_b1 | 0.3364 | 0.2765 | 0.4009 | Visual |
| 1341348523492__result_4KBN_128FV_a10_b1 | 0.3356 | 0.2688 | 0.4228 | Visual |
| PRA | MiAP | GMiAP | F-ex | Features |
|---|---|---|---|---|
| 1341306249556__svm_mean | 0.0857 | 0.0417 | 0.3331 | Visual |
| 1341307557750__svm_majority_selection | 0.0837 | 0.0403 | 0.3140 | Visual |
| 1341312033114__svm_dynamic_score_selection | 0.0900 | 0.0437 | 0.2529 | Visual |
| UAIC | MiAP | GMiAP | F-ex | Features |
|---|---|---|---|---|
| 1340348352281__submision1 | 0.2359 | 0.1685 | 0.4359 | Visual |
| 1340348434346__submision2 | 0.1863 | 0.1245 | 0.4354 | Multimodal |
| 1340348489605__submision3 | 0.1521 | 0.1017 | 0.4144 | Multimodal |
| 1340348583288__submision4 | 0.1504 | 0.1063 | 0.4206 | Multimodal |
| 1340348681456__submision5 | 0.1482 | 0.1000 | 0.4143 | Multimodal |
| UNED | MiAP | GMiAP | F-ex | Features |
|---|---|---|---|---|
| 1340596306907__UNED_UV_01_CLASS_IMG_NOTADJUST | 0.1020 | 0.0512 | 0.1081 | Visual |
| 1340597220209__UNED_UV_02_CLASS_IMG_RELEVANTSEL_NONREL_OUTSIDE | 0.0932 | 0.0475 | 0.1227 | Visual |
| 1340597731356__UNED_UV_03_CLASS_IMG_RELEVANTSEL_NONREL_INSIDE | 0.0873 | 0.0441 | 0.1360 | Visual |
| 1340878836459__UNED_UV_04_CLASS_Img_base2_TextualFilter | 0.0756 | 0.0376 | 0.0849 | Multimodal |
| 1340876077953__UNED_UV_05_CLASS_Img_base3_TextualFilter | 0.0758 | 0.0383 | 0.0864 | Textual |
| URJCyUNED | MiAP | GMiAP | F-ex | Features |
|---|---|---|---|---|
| 1340955853089__run1_image | 0.0622 | 0.0254 | 0.1984 | Visual |
| 1340977673169__run2_texto | 0.0622 | 0.0254 | 0.3527 | Textual |
| 1340977928858__run3_mix1 | 0.0622 | 0.0254 | 0.2306 | Multimodal |
| 1340978141242__run4_mix2 | 0.0622 | 0.0254 | 0.2299 | Multimodal |
Note that the MAP and GMAP are very dependent on ties in the confidence scores of images. An example case is URJCyUNED, where all images in each run received a confidence score of 1.0. This resulted in only a single precision-recall value computed for all these images combined, which happened to be the same for each run. In contrast, the F-ex scores are based on the binary annotations, and these scores were thus not affected by any ties.
| Attachment | Size |
|---|---|
| 11.51 MB | |
| 15.06 MB | |
| 19.11 MB | |
| 19.21 MB | |
| 18.97 MB | |
| 7.79 MB | |
| 18.98 MB | |
| 18.78 MB | |
| 18.8 MB | |
| 18.93 MB | |
| 18.88 MB | |
| 15.11 MB | |
| 19.35 MB | |
| 19.44 MB | |
| 15.26 MB | |
| 11.26 MB | |
| 18.83 MB | |
| 19.39 MB | |
| 15.29 MB | |
| 9.47 KB |