- ImageCLEF 2024
- LifeCLEF 2024
- ImageCLEF 2023
- LifeCLEF 2023
- ImageCLEF 2022
- LifeCLEF2022
- ImageCLEF 2021
- LifeCLEF 2021
- ImageCLEF 2020
- LifeCLEF 2020
- ImageCLEF 2019
- LifeCLEF 2019
- ImageCLEF 2018
- LifeCLEF 2018
- ImageCLEF 2017
- LifeCLEF2017
- ImageCLEF 2016
- LifeCLEF 2016
- ImageCLEF 2015
- LifeCLEF 2015
- ImageCLEF 2014
- LifeCLEF 2014
- ImageCLEF 2013
- ImageCLEF 2012
- ImageCLEF 2011
- ImageCLEF 2010
- ImageCLEF 2009
- ImageCLEF 2008
- ImageCLEF 2007
- ImageCLEF 2006
- ImageCLEF 2005
- ImageCLEF 2004
- ImageCLEF 2003
- Publications
- Old resources
You are here
GeoLifeCLEF 2019

This evaluation campaign is now over, but the train data stays freely accessible and usable for non commercial purposes, while the perenial evaluation of runs on the test set ground truth will be soon opened on AIcrowd (https://www.aicrowd.com/).
Registration and data access
as username.
- First name
- Last name
- Affiliation
- Address
- City
- Country
Usage scenario
Automatically predicting the list of species that are the most likely to be observed at a given location is useful for many scenarios in biodiversity informatics. First of all, it could improve species identification processes and tools by reducing the list of candidate species that are observable at a given location (be they automated, semi-automated or based on classical field guides or flora). More generally, it could facilitate biodiversity inventories through the development of location-based recommendation services (typically on mobile phones) as well as the involvement of non-expert nature observers. Last but not least, it might serve educational purposes thanks to biodiversity discovery applications providing functionalities such as contextualized educational pathways.
Challenge
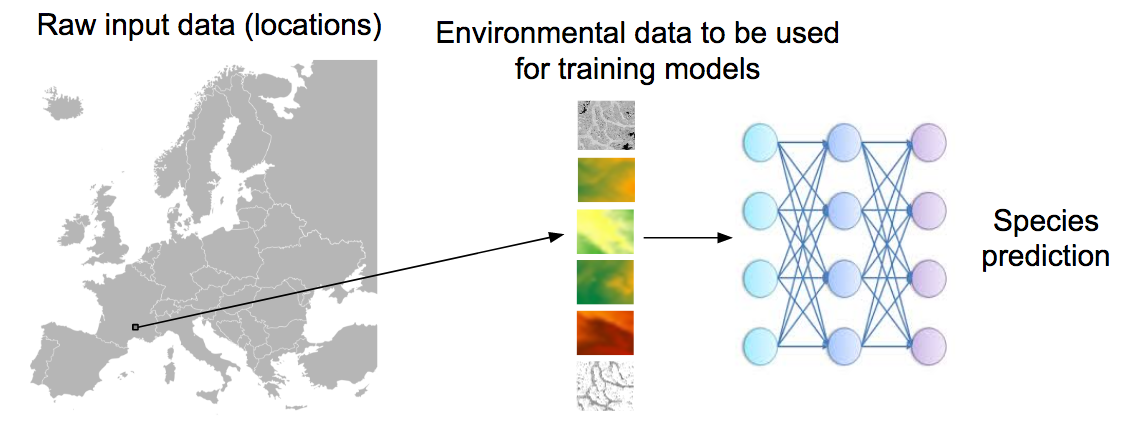
The aim of the challenge is to predict the list of species that are the most likely to be observed at a given location. Therefore, we will provide a large training set of species occurrences, each occurrence being associated to a multi-channel image characterizing the local environment. Indeed, it is usually not possible to learn a species distribution model directly from spatial positions because of the limited number of occurrences and the sampling bias. What is usually done in ecology is to predict the distribution on the basis of a representation in the environmental space, typically a feature vector composed of climatic variables (average temperature at that location, precipitation, etc.) and other variables such as soil type, land cover, distance to water, etc. The originality of GeoLifeCLEF is to generalize such niche modeling approach to the use of an image-based environmental representation space. Instead of learning a model from environmental feature vectors, the goal of the task will be to learn a model from k-dimensional image patches, each patch representing the value of an environmental variable in the neighborhood of the occurrence (see figure below for an illustration).
Data
Train and Test data downloadable at https://www.aicrowd.com/challenges/lifeclef-2019-geo.
Check out the Python scripts to simplify formatting of the dataset for the learning process (provided here https://github.com/maximiliense/GLC19).
This year, the train dataset is augmented compared to the 2018 edition. In a nutshell, it will first include 280,945 train and test georeferenced occurrences of plant species from last year (CSV file http://otmedia.lirmm.fr/LifeCLEF/GeoLifeCLEF2019/GLC_2018.csv, DOIs: https://doi.org/10.15468/dl.vqsrdc, https://doi.org/10.15468/dl.wrhgft). Plus, 2,367,145 plant species occurrences with uncertain identifications are added (CSV file http://otmedia.lirmm.fr/LifeCLEF/GeoLifeCLEF2019/PL_complete.csv). They come from automatic species identification of pictures produced in 2017-2018 by the smartphone application Pl@ntNet, where users are mainly amators botanists. A trusted extraction of this dataset is also provided (CSV file http://otmedia.lirmm.fr/LifeCLEF/GeoLifeCLEF2019/PL_trusted.csv), insuring a reasonable level of identification certainty. Finally, 10,618,839 species occurrences from other kingdoms (as mammals, birds, amphibias, insects, fungis etc.) were selected from the GBIF database (CSV file http://otmedia.lirmm.fr/LifeCLEF/GeoLifeCLEF2019/noPlant.csv, DOIs: Amphibia: https://doi.org/10.15468/dl.1svgnx, Insecta: https://doi.org/10.15468/dl.feenmn, Mammalia : https://doi.org/10.15468/dl.pzgnxq, Aves: https://doi.org/10.15468/dl.ftdyfi, Reptilia: https://doi.org/10.15468/dl.xsqc29, Arachnida: https://doi.org/10.15468/dl.d9vgqp, Basidiomycota: https://doi.org/10.15468/dl.bpst9c). 33 environmental rasters covering the French territory are made available this year (download: http://otmedia.lirmm.fr/LifeCLEF/GeoLifeCLEF2019/rasters%20GLC19/, DOI: https://doi.org/10.5281/zenodo.2635501), so that each occurrence may be linked to an environmental tensor via a participant customizable Python code (Github project: https://github.com/maximiliense/GLC19). These environmental rasters were constructed from various open datasets including Chelsea Climate [1], ESDB soil pedology data [2,3,4], Corine Land Cover 2012 soil occupation data, CGIAR-CSI evapotranspiration data [5,6], USGS Elevation data (Data available from the U.S. Geological Survey.) and BD Carthage hydrologic data.
The test occurrences data come from independents datasets of the French National Botanical Conservatories. This TestSet includes 844 plant species. It is a subset of those found in the train set. Those species are indicated in the column “test” of the Table of species IDs and names and identification of TestSet species, downloadable on the Dataset tab. A detailed description of the protocol used to build the datasets is available in the Protocol_Note, download from the “Dataset” tab.
External data
Participants are allowed to use other external training data but at the condition that (i) the experiment is entirely re-produceable, i.e. that the used external ressource is clearly referenced and accessible to any other research group in the world, (ii) participants submit at least one run without external training data so that we can study the contribution of such ressources, (iii) the additional ressource does not contain any of the test observations.
Metric
The main evaluation criteria will be the accuracy based on the 30 first answers, also called Top30. It is the mean of the function scoring 1 when the good species is in the 30 first answers, and 0 otherwise, over all test set occurrences. This metric has been carefully chosen for this challenge because it account for the known scientific fact that some tens of plant species usually coexist in the perimeter of the geolocation uncertainty of the occurrences. The Mean Reciprocal Rank was chosen as secondary metric for enabling comparison with the 2018 edition.
Submission instructions
Each team is allowed to submit 20 runs maximum. A run is a .csv file with 4 columns separated by “;” and containing in this order : glc19TestOccId ; glc19SpId ; Rank ; Probability
Here is an example of the 5 first lines of a run file :
1 ; 10 ; 1 ; 0.5
1 ; 25 ; 2 ; 0.3
1 ; 301 ; 3 ; 0.2
2 ; 34 ; 1 ; 0.9
2 ; 41 ; 2 ; 0.1
**Please watch your runs format**. The 1st, 2nd and 3rd columns (respectively glc19TestOccId, glc19SpId and Rank) should be integers, while the last column probability is a float. One can give up to 50 species (glc19SpId) for an occurrence ID (glc19TestOccId), which must be distinct and their ranks must be strictly consecutive starting from 1. Each occurrence ID in the submitted run must exist in the testSet file (glc19TestOccId). Each species ID must match be one the species (glc19SpId) marked as TRUE in the column "test" of the **Table of species Ids and names and identification of test set species**.
WARNING: Any run inducing an error is NOT counted for the limit , except above 30 faulty runs, where it will count as a valid run. Exemples:
WARNING: There is no leaderboard while submission is open for this task. We removed it to maximize the independence between submitted algorithms and test data, and thus significance of results for future research purposes.
Registration and data access
Please refer to the general LifeCLEF registration instructions
Results
Graph of Figure 1 summarizes the Top30 (Ranking metric) per run and participant name. Graph of Figure 2 summarizes a secondary metric, the Mean Reciprocal Rank per run and participant name. This metric was the one used in the GeoLifeCLEF 2018 edition, though the test set set was very different. The correspondence between Runs IDs and run files names submitted by participant are given by Table 1.
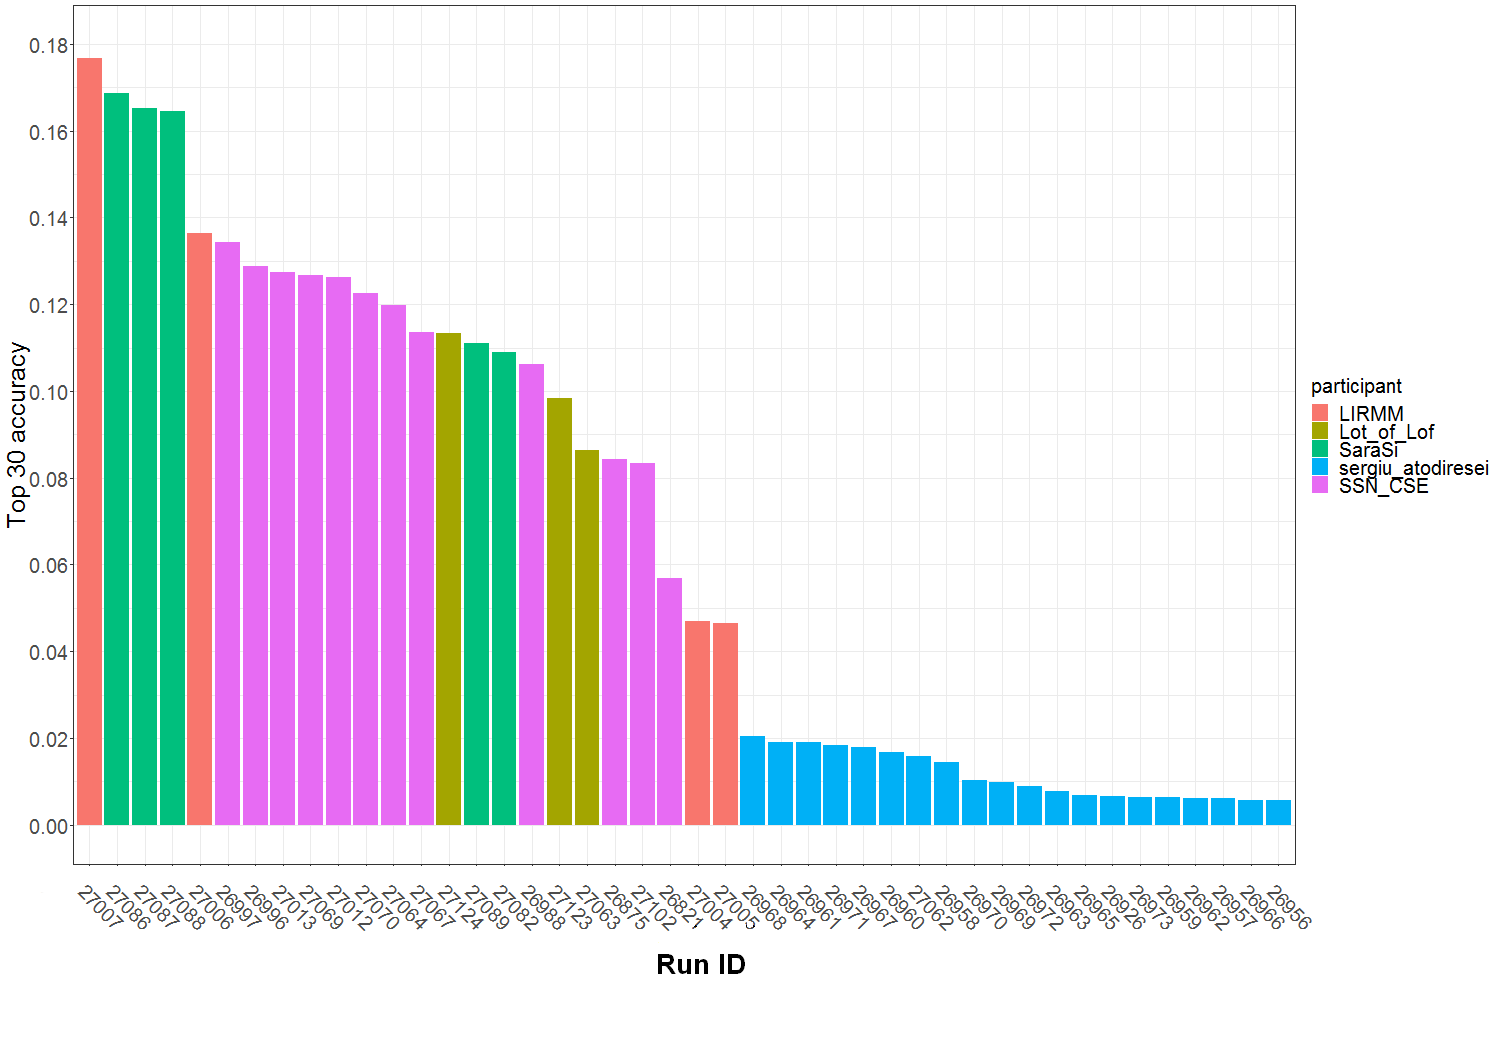
Figure 1 : Top 30 accuracy per submitted run ID and participant team.
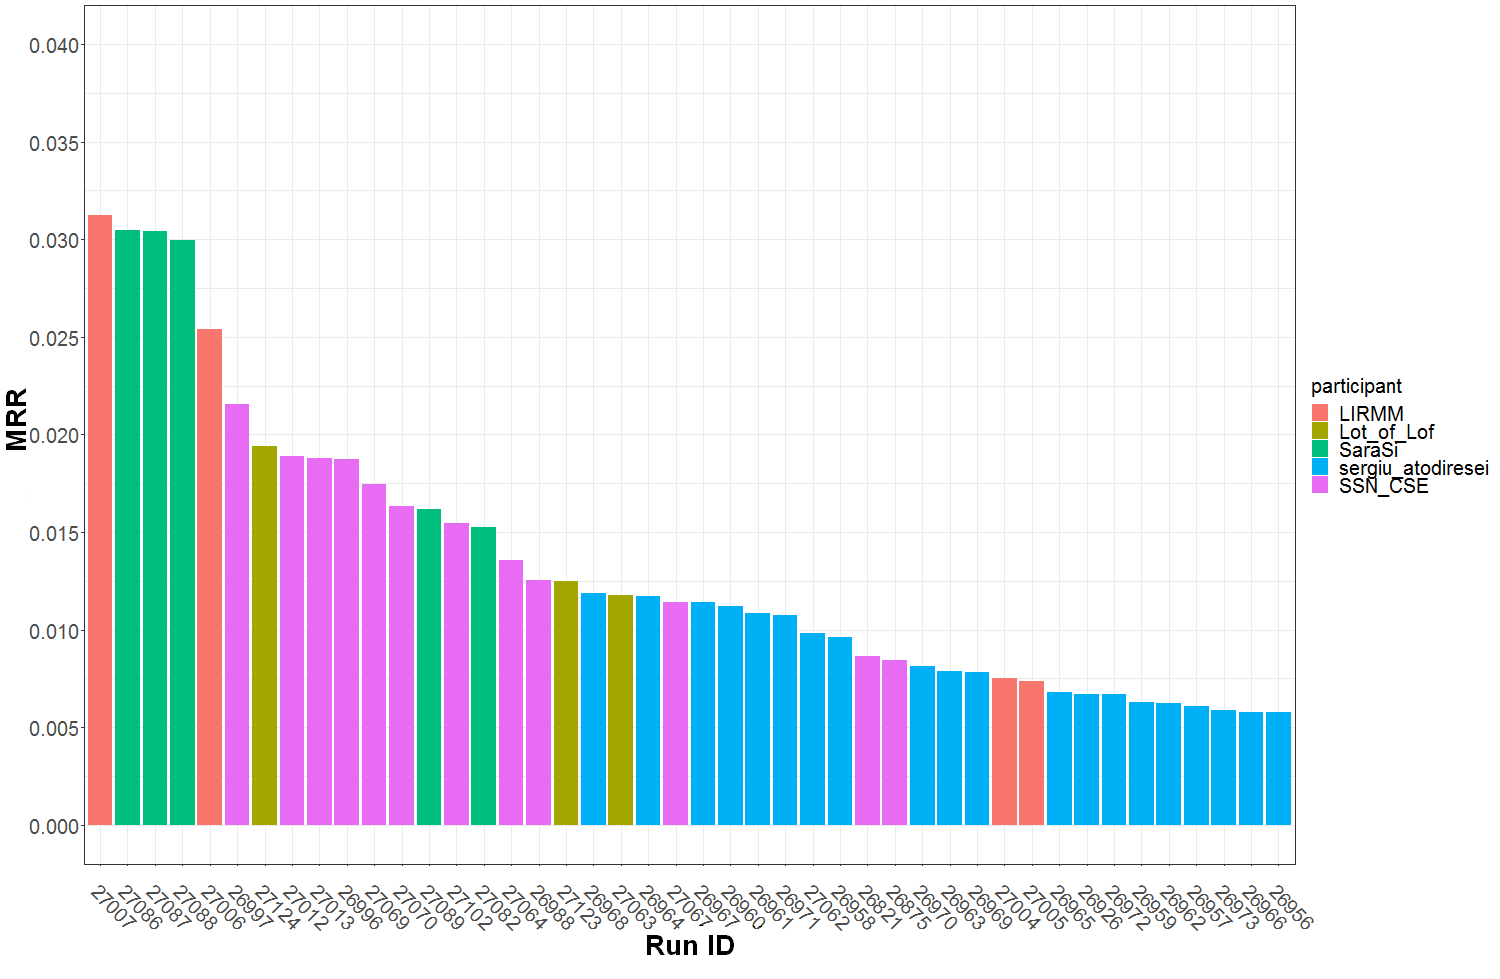
Figure 2 : MRR (Mean Reciprocal Rank) per submitted run ID and participant team.
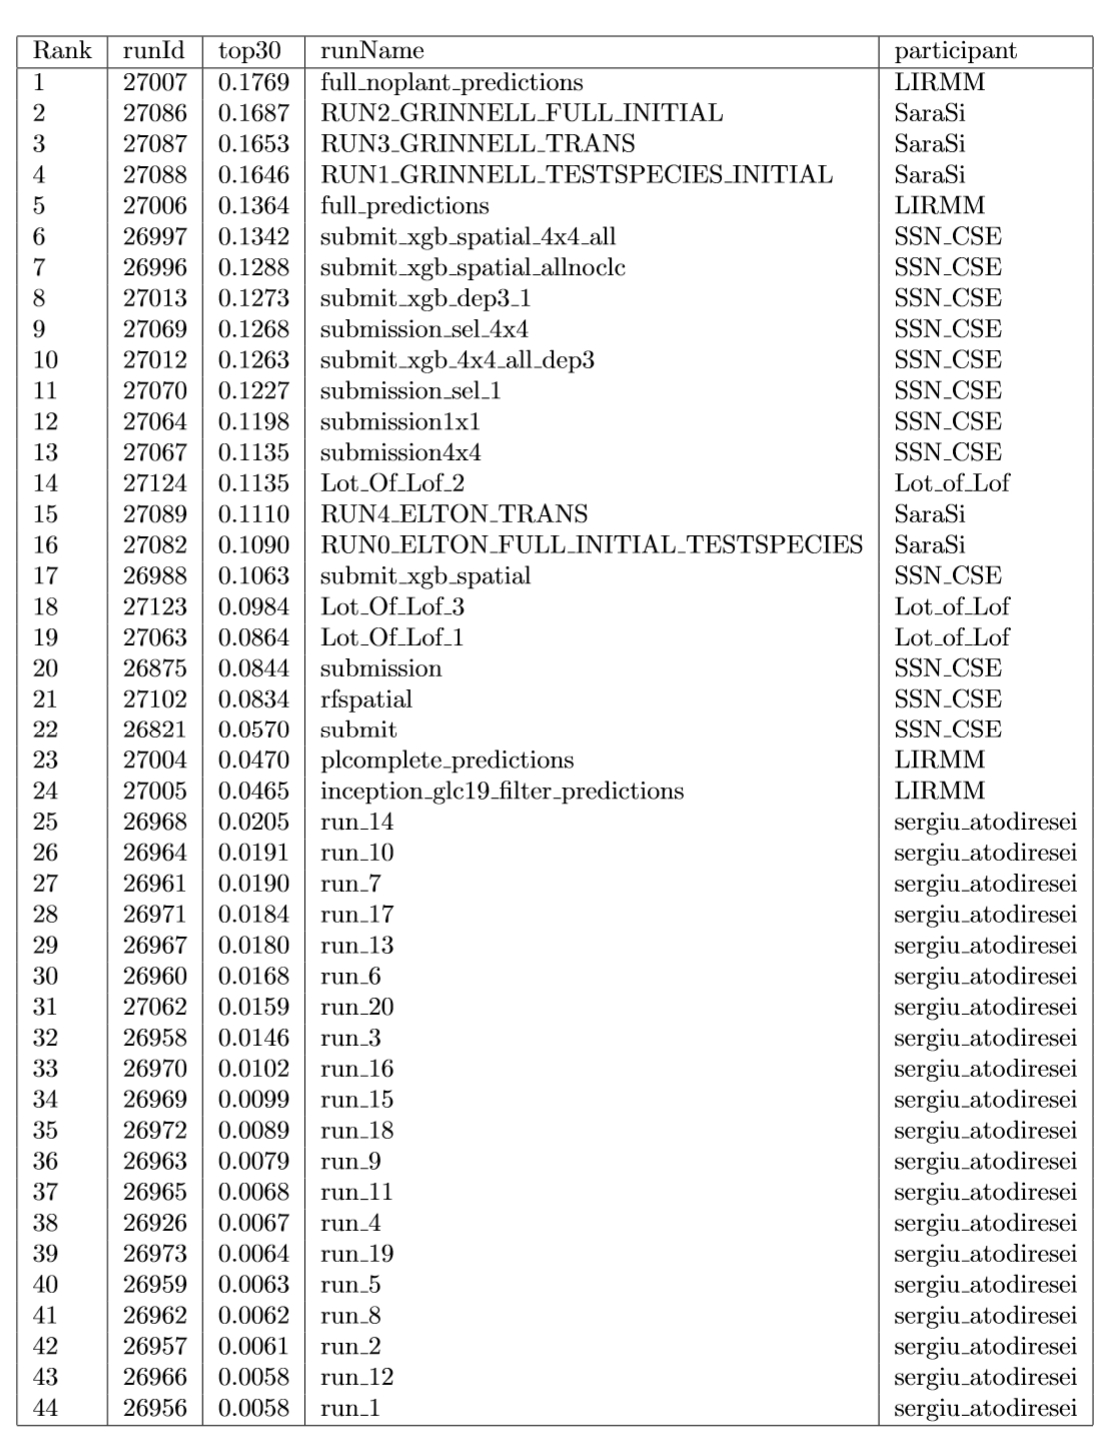
Table 1: Runs summary table.
Working Notes <\h2>
The overview of GeoLifeCLEF 2019 summarizes the whole task while each participant working note summarizes its own methods and results. All are available at http://ceur-ws.org/Vol-2380/<\a>.
References
[1] Karger, Dirk Nikolaus, Conrad, Olaf, Böhner, Jürgen, Kawohl, Tobias, Kreft, Holger, Soria-Auza,
Rodrigo Wilber, Zimmermann, Niklaus, Linder, H Peter, & Kessler, Michael. 2016. Climatologies
at high resolution for the earth’s land surface areas. arXiv preprint arXiv :1607.00217.
[2] Panagos, Panos. 2006. The European soil database. GEO : connexion, 5(7), 32–33.
[3] Panagos, Panos, Van Liedekerke, Marc, Jones, Arwyn, & Montanarella, Luca. 2012. European Soil
Data Centre : Response to European policy support and public data requirements. Land Use Policy,
29(2), 329–338.
[4] Van Liedekerke, M, Jones, A, & Panagos, P. 2006. ESDBv2 Raster Library-a set of rasters derived
from the European Soil Database distribution v2. 0. European Commission and the European Soil
Bureau Network, CDROM, EUR, 19945.
[5] Zomer, Robert J, Bossio, Deborah A, Trabucco, Antonio, Yuanjie, Li, Gupta, Diwan C, & Singh,
Virendra P. 2007. Trees and water : smallholder agroforestry on irrigated lands in Northern India.
Vol. 122. IWMI.
[6] Zomer, Robert J, Trabucco, Antonio, Bossio, Deborah A, & Verchot, Louis V. 2008. Climate change
mitigation : A spatial analysis of global land suitability for clean development mechanism afforestation
and reforestation. Agriculture, ecosystems & environment, 126(1), 67–80.
| Attachment | Size |
|---|---|
| 620.56 KB | |
| 33.01 KB | |
| 33.36 KB |