- ImageCLEF 2024
- LifeCLEF 2024
- ImageCLEF 2023
- LifeCLEF 2023
- ImageCLEF 2022
- LifeCLEF2022
- ImageCLEF 2021
- LifeCLEF 2021
- ImageCLEF 2020
- LifeCLEF 2020
- ImageCLEF 2019
- LifeCLEF 2019
- ImageCLEF 2018
- LifeCLEF 2018
- ImageCLEF 2017
- LifeCLEF2017
- ImageCLEF 2016
- LifeCLEF 2016
- ImageCLEF 2015
- LifeCLEF 2015
- ImageCLEF 2014
- LifeCLEF 2014
- ImageCLEF 2013
- ImageCLEF 2012
- ImageCLEF 2011
- ImageCLEF 2010
- ImageCLEF 2009
- ImageCLEF 2008
- ImageCLEF 2007
- ImageCLEF 2006
- ImageCLEF 2005
- ImageCLEF 2004
- ImageCLEF 2003
- Publications
- Old resources
You are here
SeaCLEF 2017
News: 21/05 Results for tasks 1, 2 and 3 are available.
Usage scenario
The SeaCLEF 2017 task originates from the previous editions (2014 and 2015,2016) of marine organism identification in visual data for ecological surveillance and biodiversity monitoring. SeaCLEF 2017 significantly extends past editions in the tackled marine organisms species as well in the application tasks.
The need of automated methods for sea-related multimedia data and to extend the originary tasks is driven by the recent sprout of marine and ocean observation approaches (mainly imaging - including thermal - systems) and their employment for marine ecosystem analysis and biodiversity monitoring. Indeed in recent years we have assisted an exponential growth of sea-related multimedia data in the forms of images/videos/sounds, for disparate reasoning ranging from fish biodiversity monitoring to marine resource managements to fishery to educational purposes. However, the analysis of such data is particularly expensive for human operators, thus limiting greatly the impact that the technology may have in understanding and sustainably exploiting the sea/ocean.
Data collection
Data collection: the SeaCLEF 2017 multimedia dataset contains images and videos of marine organisms. In all cases, the goal is to identify species or individuals from either images or videos.
In terms of tackled species, SeaCLEF will involves about 150 marine animals species from all over the world.
In particular the SeaCLEF datasets contains:
1) A set of videos recorded in Taiwan coral reefs for automated fish detection and species recognition;
2) A set of videos recorded near a water turbine for automated detection of rare events involving the presence of salmons;
3) A set of images of 148 marine animal species, weakly labelled.
4) A set of image pairs of of whale caudals.
Tasks description and datasets
According to the data available in the SeaCLEF 2017 contest, we defined four tasks:
Task 1: Automated Fish Identification and Species Recognition on Coral Reef Videos
The participants have access to the training set consisting of twenty underwater videos. The goal of the task is to automatically identify and recognize fish species. The fish species present in all videos as well as bounding boxes and fish species labels are
also provided in the training data.
Task 2: Automated Frame-level Salmon Identification in Videos for Monitoring Water Turbine
For this case, the participants have access initially to the training set consisting of eight underwater videos. The goal of the task is to identify in which frames salmon appear. Such events are pretty rate and salmons are often very small, thus the task mainly pertains detection of rare events involving unclear objects (salmons). Frame-level annotations indicating the presence of salmons are given along with salmon videos.
Task 3: Marine Animal Species Recognition using Weakly-Labelled Images and Relevance Ranking
Contrary to the previous tasks, this one aims at classifying marine animals from 2D images. The main difficulties of the task are: 1) high similarity between species and 2) weak annotations, for training, gathered automatically from the Web and filtered by non-experts. In particular, the training dataset consists of up to 100 images for each considered species (in total 148 fish species). Training images are weakly labelled, i.e., web images have retrieved automatically from the web using marine animal scientific names as query. The retrieved images were then filtered by non-experts who were instructed to only remove images not showing fish/marine animals. Furthermore, the filename for each image provides information about the relevance (relevance ranking) to the query and must be used during training. For example, for a given species X, the retrieved images are named from 1 to 100, with 1 being the most relevant image and 100 the less relevant one.
Task 4: Whale Individual Recognition
This task will aim at automatically matching image pairs, over a large set images, of same individual whales (such as the 3 matches of Figure 1) through the analysis of their caudal fins. Indeed, caudal fin that is most discriminant pattern for distinguishing an individual whale from another. Finding the images that correspond to the same individual whale is a crucial step for further biological analysis (e.g. for monitoring population displacement) and it is currently done manually by human operators (hence a painful, error prone and definitely unscalable process).
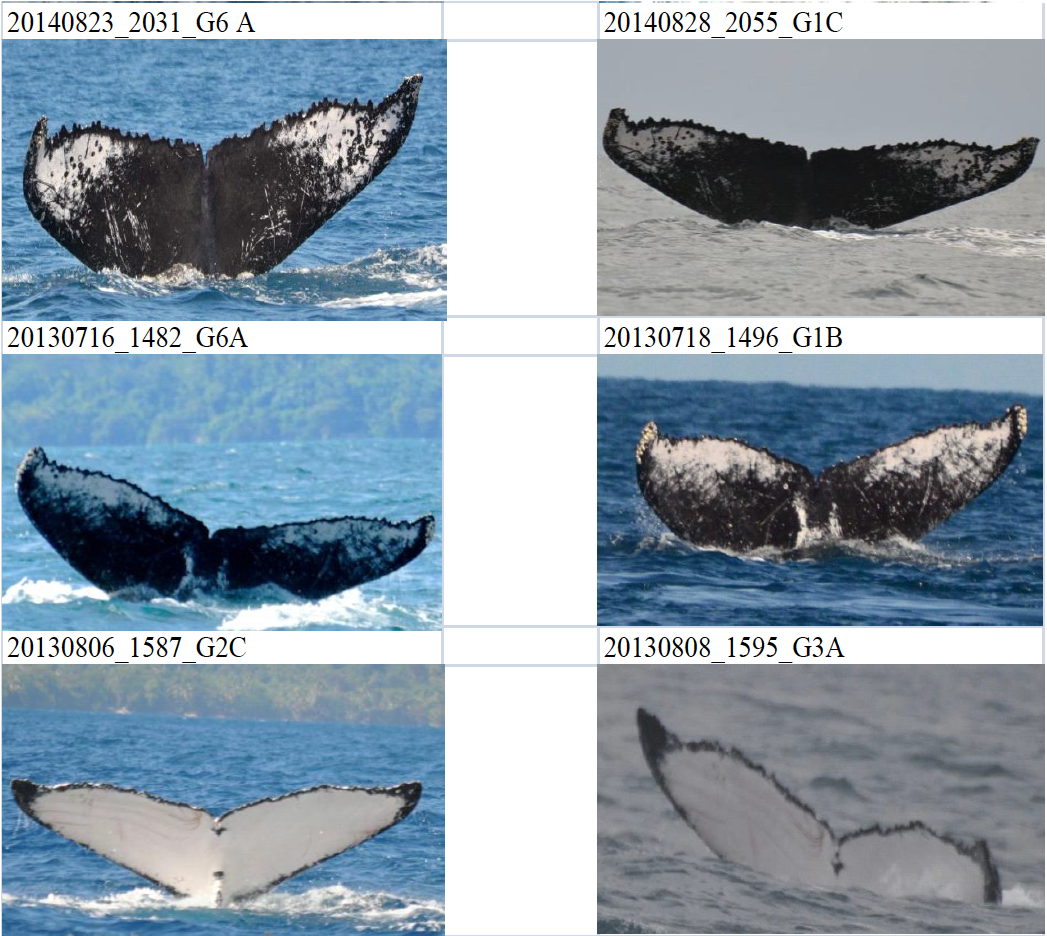
Figure 1: illustration of 3 individual whale matches (each line correspond to two images of the same individual)
Task participation and run format
Participants are not expected to provide runs for all tasks, but can choose one (or a combination) of them. In particular
1) Teams submitting runs for task 1 have to submit runs for task 2 as well and vice versa.
2) Task 3 and task 4 are independent.
The participants must provide a run file named as TeamName_TaskX_runY.XML where X is the identifier of the task and Y the identifier of the run (up to three runs per participant per task).
The following XML files describe, respectively, the run formats for Task 1, Task 2 and Task 3.
Run Format 1
Run Format 2
Run Format 3
For task 4, participants must provide a run file (a raw text file) named as "TeamName_whalerun_X.txt" where X is the identifier of the run (up to three runs per participant). The run file must contain as much lines as the number of discovered matches, each match being a triplet of the form:
<imageX.jpg imageY.jpg score>
where score is a confidence score between 0 and 1 (1 for highly confident matches). The matches have to be sorted by decreasing confidence score. A run should not contain any duplicate match (e.g. [imageX.jpg imageY.jpg score1] and [imageY.jpg imageX.jpg score2] should not appear in the same run file). Here is a short fake run example respecting this format and containing only 6 fake matches:
SEACLEForgs_whalerun_2.txt
Metrics
As scoring functions for task 1 we will compute:
- The counting score (CS) defined as
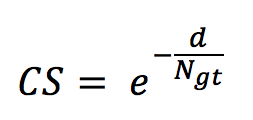
with d being the difference between the number of occurrences in the run (per species) and the number of occurrences in the ground truth N_gt. - The precision defined as
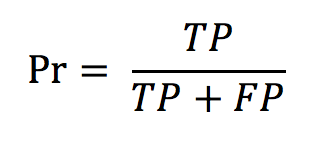
with TP and FP being, respectively, the true positives and the false positives. - The normalised counting score (NCS) defined as
NCS = CS x Pr
For task 2 we will compute the average per video F-measure score combining precision and recall.
For task 3 we will computer average Precisions: P@1, P@3 and P@5.
The metrics used for task 4 will be the Average Precision (i.e. the precision averaged across all good matches of the groundtruth).
Results
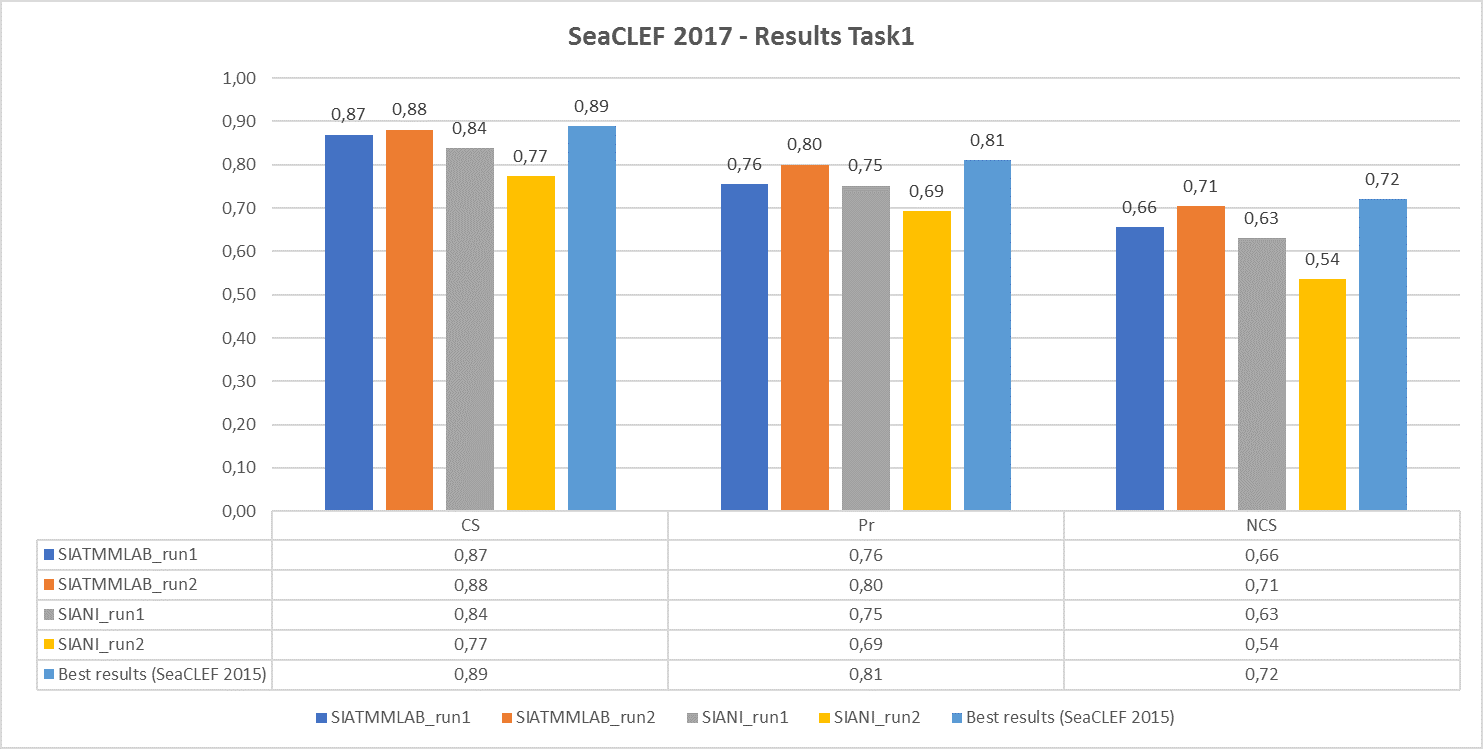
Task 1
The following chart shows, respectively, the average (per video and species) normalized counting score, precision and counting score obtained by the runs submitted by the two participant teams (SIATMMLAB and SIANI). The graph also shows the best performance achieved on the same dataset in the previous competition (2015)
Task 2
For this task, only one participant (SIATMMLAB) submitted only one run, achieving the following results:
Precision = 0.04, Recall =0.82 and F-measure = 0.07. The low performance, especially due to false positives, demonstrates the complexity of this task.
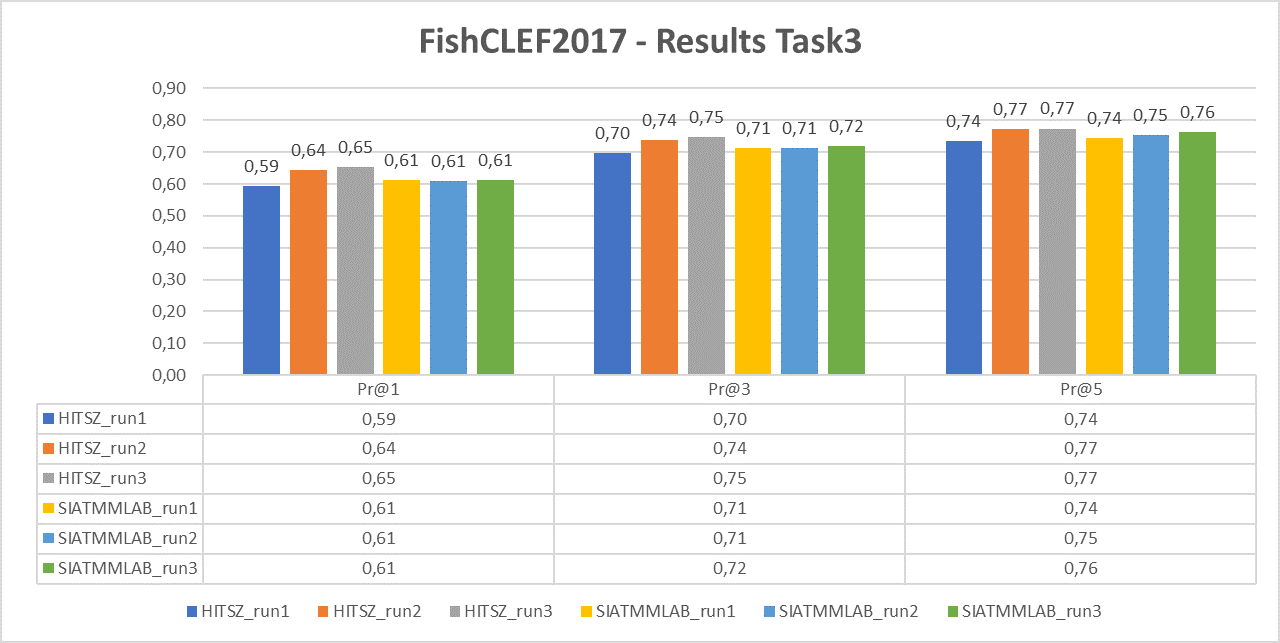
Task 3
The following chart reports the performance in terms of P@1, P@3 and P@5 of the two participant teams (HITSZ and SIATMMLAB) that submitted three runs each.
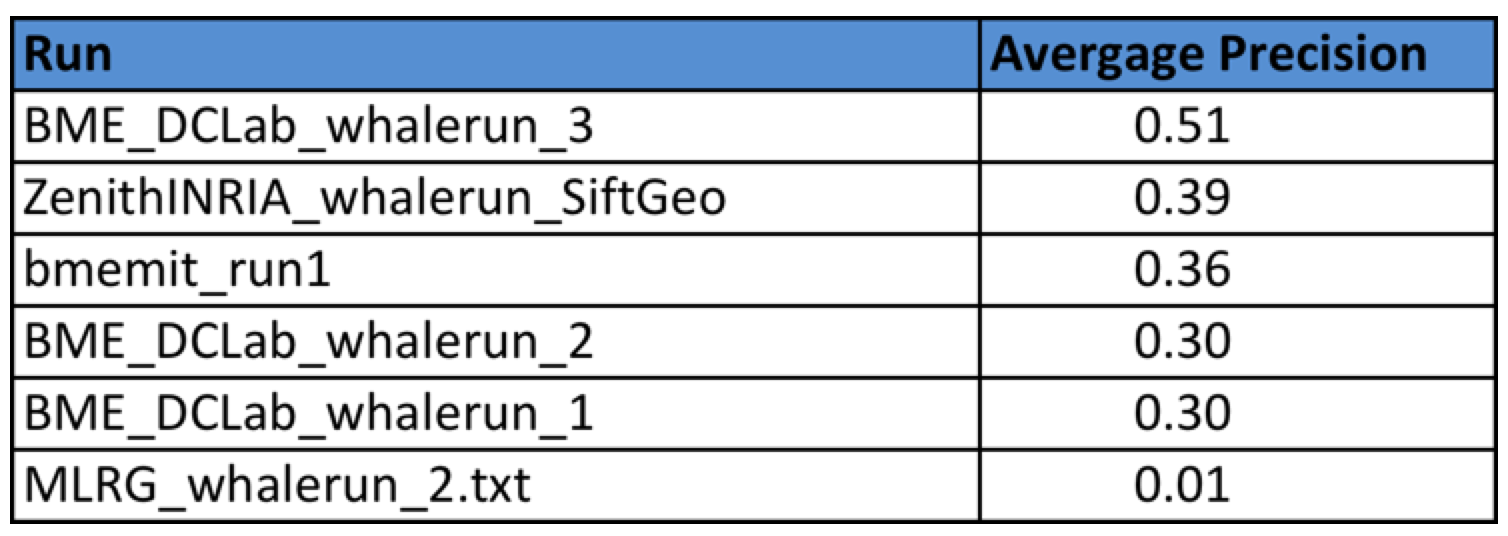
Task 4
Four research groups submitted a total of 6 runs. The following table provides the Average Precision of the 6 runs. Details of the used methods can be found in the working note of the task (to be published soon).
| Attachment | Size |
|---|---|
| 1.81 MB | |
| 2.15 KB | |
| 1.17 KB | |
| 1.8 KB | |
| 44.25 KB | |
| 51.34 KB |