- ImageCLEF 2026
- LifeCLEF 2026
- ImageCLEF 2025
- LifeCLEF 2025
- ImageCLEF 2024
- LifeCLEF 2024
- ImageCLEF 2023
- LifeCLEF 2023
- ImageCLEF 2022
- LifeCLEF2022
- ImageCLEF 2021
- LifeCLEF 2021
- ImageCLEF 2020
- LifeCLEF 2020
- ImageCLEF 2019
- LifeCLEF 2019
- ImageCLEF 2018
- LifeCLEF 2018
- ImageCLEF 2017
- LifeCLEF2017
- ImageCLEF 2016
- LifeCLEF 2016
- ImageCLEF 2015
- LifeCLEF 2015
- ImageCLEF 2014
- LifeCLEF 2014
- ImageCLEF 2013
- ImageCLEF 2012
- ImageCLEF 2011
- ImageCLEF 2010
- ImageCLEF 2009
- ImageCLEF 2008
- ImageCLEF 2007
- ImageCLEF 2006
- ImageCLEF 2005
- ImageCLEF 2004
- ImageCLEF 2003
- Publications
- Old resources
You are here
PlantCLEF 2019
| News |
| A direct link to the overview of the task: Overview of LifeCLEF Plant Identification Task 2019: diving into Data Deficient Tropical Countries, Hervé Goëau, Pierre Bonnet, Alexis Joly, LifeCLEF 2019 working notes, Lugano, Switzerland |
| Link to the data https://lab.plantnet.org/LifeCLEF/PlantCLEF2019/ |
Registration and data access
as username.
- First name
- Last name
- Affiliation
- Address
- City
- Country
Usage scenario
Automated identification of plants has improved considerably in the last few years. In the scope of LifeCLEF 2017 and 2018 in particular, we measured impressive identification performance over 10K species. However, these 10K species, mostly living in Europe and North America, only represent the tip of the iceberg. The vast majority of the species in the world (~369K species) actually lives in data deficient countries and the performance of state-of-the-art machine learning algorithms on these species is unknown and presumably much lower. Thus, the main novelty of the 2019 edition of PlantCLEF will be to extend the challenge to the flora of such data deficient countries. Thus, the main focus of the 2019 edition of PlantCLEF will be to evaluate automated identification on the flora of such data deficient regions.
Challenge description
The goal of the task is return the most likely species for each observation of the test set (an observation being a set of images of the same individual plant and the associated metadata such as date, gps, author). A small part of the observations in the test set will be re-annotated by several experts so as to allow comparing the performance of the evaluated systems with the one of highly skilled experts.
Data Collection
We provide a new dataset of 10K species mainly focused on the Guiana shield and the Amazon rainforest (known to be the largest collection of living plants and animal species in the world). The average number of images per species in that new dataset will be much lower than the dataset used in the previous editions of PlantCLEF (about 10 vs. 100). Many species will contain only a few images and some of them might even contain only 1 image.
Metric
The main evaluation metric will be the top-1 accuracy.
Results
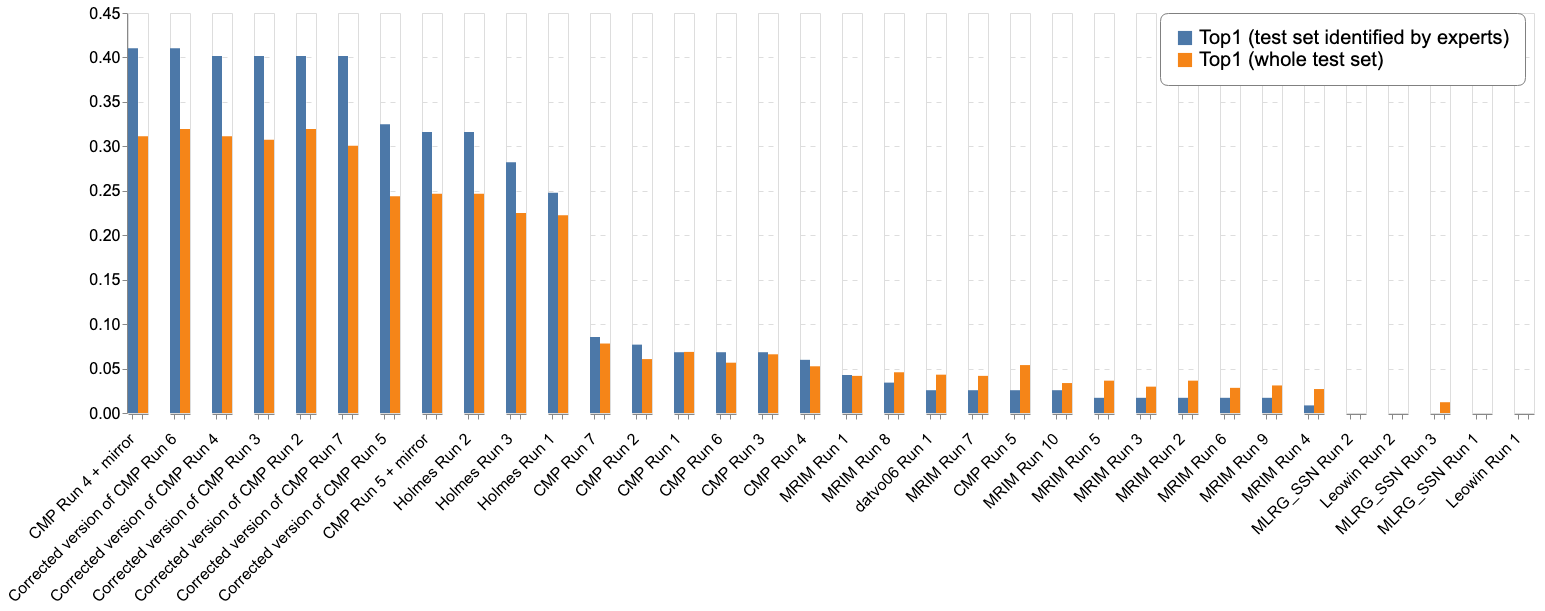
A total of 6 participating groups submitted 26 runs. Thanks to all of you for your efforts!
| Team run | Filename | Top1 (test set identified by experts) | Top1 (whole test set) | |||||||||||||||||||||||||||||||||||||||||||||||||||||||||||||||||||||||||||||||||||||||||||||||||||||||||||||||||||||||||
|---|---|---|---|---|---|---|---|---|---|---|---|---|---|---|---|---|---|---|---|---|---|---|---|---|---|---|---|---|---|---|---|---|---|---|---|---|---|---|---|---|---|---|---|---|---|---|---|---|---|---|---|---|---|---|---|---|---|---|---|---|---|---|---|---|---|---|---|---|---|---|---|---|---|---|---|---|---|---|---|---|---|---|---|---|---|---|---|---|---|---|---|---|---|---|---|---|---|---|---|---|---|---|---|---|---|---|---|---|---|---|---|---|---|---|---|---|---|---|---|---|---|---|---|---|
| Holmes Run 2 | a7624a2f-2273-46ed-afc5-4b59c133f3c6_run_multilabel_230646_inceptionv4_inceptionresv2 | 0,316 | 0,247
| Holmes Run 3 |
6dc12138-727d-4601-adeb-559715711fc7_run_multilabel_230646_inceptionres_v2 |
0,282 |
0,225
| Holmes Run 1 |
44a0573d-57a5-4330-bbc8-4e495fa5584d_run_multilabel_230646_4850_iter101500 |
0,248 |
0,222
| CMP Run 7 |
506e467a-e71c-4fcb-970e-8473446075aa_1ensemble_10_sum_uniform_prior |
0,085 |
0,078
| CMP Run 2 |
c76bec52-f36a-4a1d-a81d-83d89e69ac79_ensemble_5_sum |
0,077 |
0,061
| CMP Run 6 |
60293483-f686-40b5-96bd-e74fa7cbfcb5_1ensemble_10_sum |
0,068 |
0,057
| CMP Run 1 |
8f3ca4e6-8ef0-4caa-89dd-17a52b5021bf_ensemble_4_sum |
0,068 |
0,069
| CMP Run 3 |
ca5dba75-d751-4a03-9d61-e39cc17286b4_ensemble_5_sum_uniform_prior |
0,068 |
0,066
| CMP Run 4 |
a4e2e0a4-3508-45cb-bc73-2ca56babe832_ensemble_5_sum_map_prior |
0,060 |
0,053
| MRIM Run 1 |
e72917e4-d038-4f43-9a4f-1ce6c5f63e7b_run_avg_max_1 |
0,043 |
0,042
| MRIM Run 8 |
47f77d8d-c6cd-4277-aae9-876e5573420d_run_max_avg_05 |
0,034 |
0,046
| MRIM Run 7 |
725e44e3-cd14-42fc-8aba-58178fcc75ba_run_avg_avg_05 |
0,026 |
0,042
| datvo06 Run 1 |
7ae276a3-8f75-4fb5-b516-151dcad3dd3a_run |
0,026 |
0,043
| CMP Run 5 |
bfa3f20a-945a-4fb2-ae38-284ef0cf10bd_ensemble_5_sum_mle_prior |
0,026 |
0,054
| MRIM Run 10 |
f9de7751-3a4c-48e2-b272-823be8512745_run_final |
0,026 |
0,034
| MRIM Run 5 |
497f4958-a5e8-4e06-ad19-0bcf29516d28_run_avg_avg_025 |
0,017 |
0,036
| MRIM Run 3 |
571ed543-96c0-4cae-9ba2-23108f3c358a_run_avg_max_05 |
0,017 |
0,030
| MRIM Run 2 |
763e921f-e397-44cd-87d1-5415b834959d_run_avg_avg_025 |
0,017 |
0,036
| MRIM Run 6 |
89025713-abdd-4960-a657-fbd3815c4551_run_max_max_025 |
0,017 |
0,028
| MRIM Run 9 |
c723c2a2-0b22-4d0d-be0c-95fbf0f9b3d9_run_max_max_05 |
0,017 |
0,031
| MRIM Run 4 |
d8d4f57d-cbb5-4441-be87-2a565b1133a9_run_avg_max_025 |
0,009 |
0,027
| MLRG_SSN Run 1 |
0338a444-4279-4251-a7cc-680fc32b88a8_submission |
0,000 |
0,000
| Leowin Run 1 |
4149b55a-6b52-4346-a5ec-9d561f18c4f3_test_updated |
0,000 |
0,000
| MLRG_SSN Run 2 |
4ce98d47-4c98-466f-8b8c-42926841ec40_sub_resnet_50_try |
0,000 |
0,000
| MLRG_SSN Run 3 |
63f5d4cc-627b-4bdc-a94c-2b600b0918fd_sub_resnet_50_all |
0,000 |
0,012
| Leowin Run 2 |
9d2a0e45-1766-40ae-838f-0546bd58b219_test_updated |
0,000 |
0,000
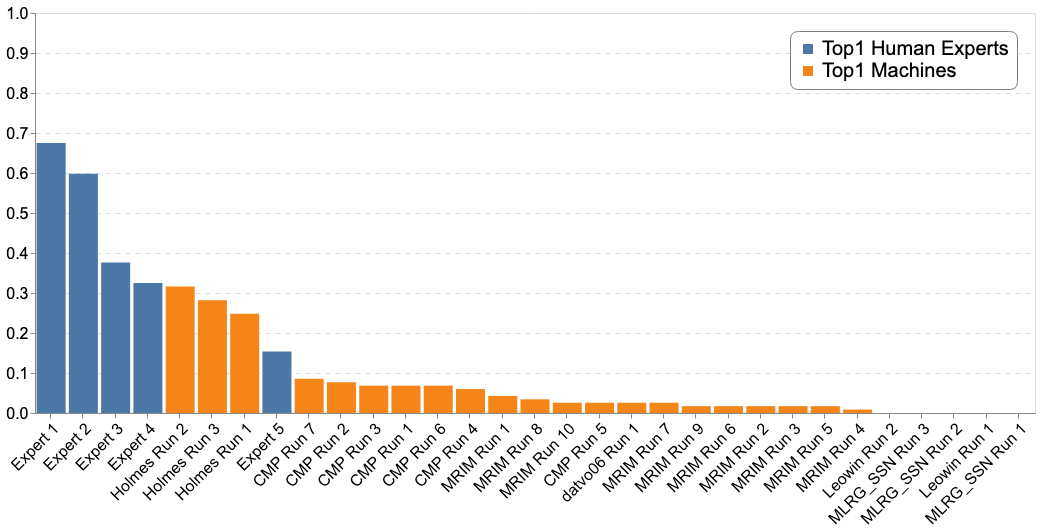
| Expert 1 |
Expert_1.csv |
0,675 |
-
| Expert 2 |
Expert_2.csv |
0,598 |
-
| Expert 3 |
Expert_3.csv |
0,376 |
-
| Expert 4 |
Expert_4.csv |
0,325 |
-
| Expert 5 |
Expert_5.csv |
0,154 |
- |
-
| |
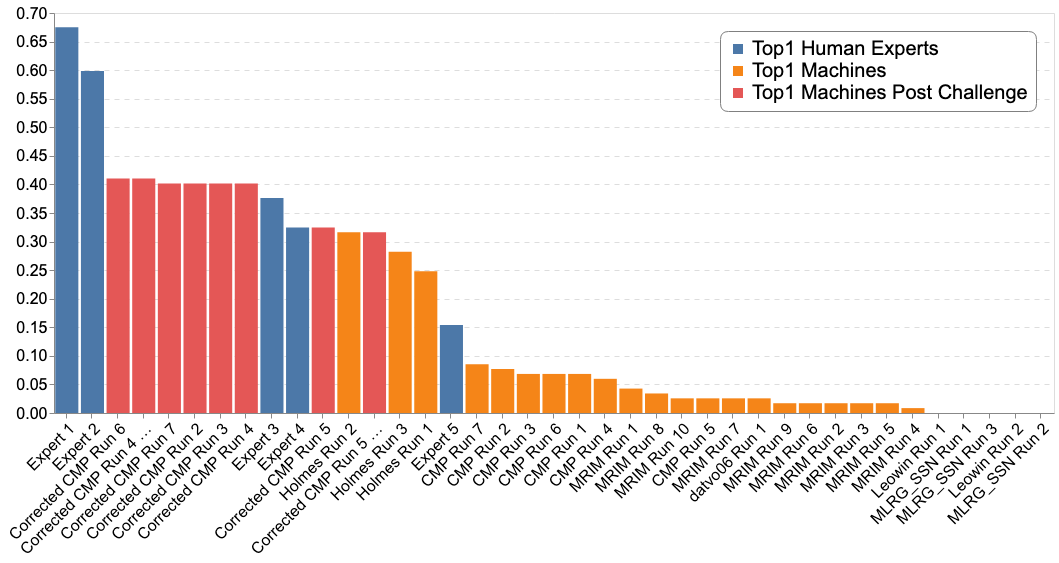
The following figure reports the comparison of the Top-1 accuracy between the "machines" and 5 human experts of the Amazonian and French Guina flora.
Complementary results
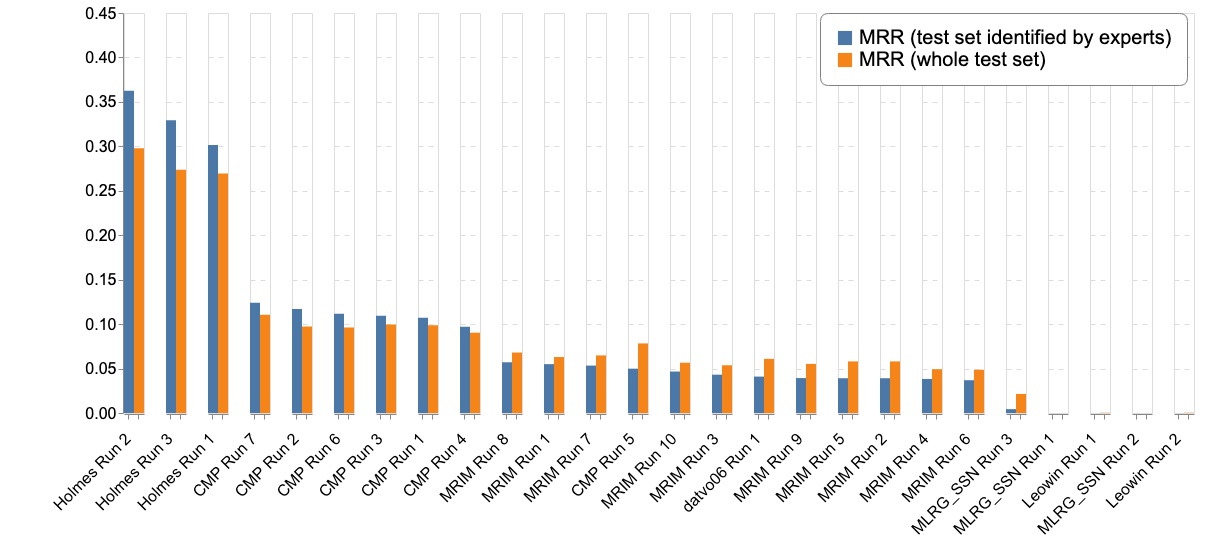
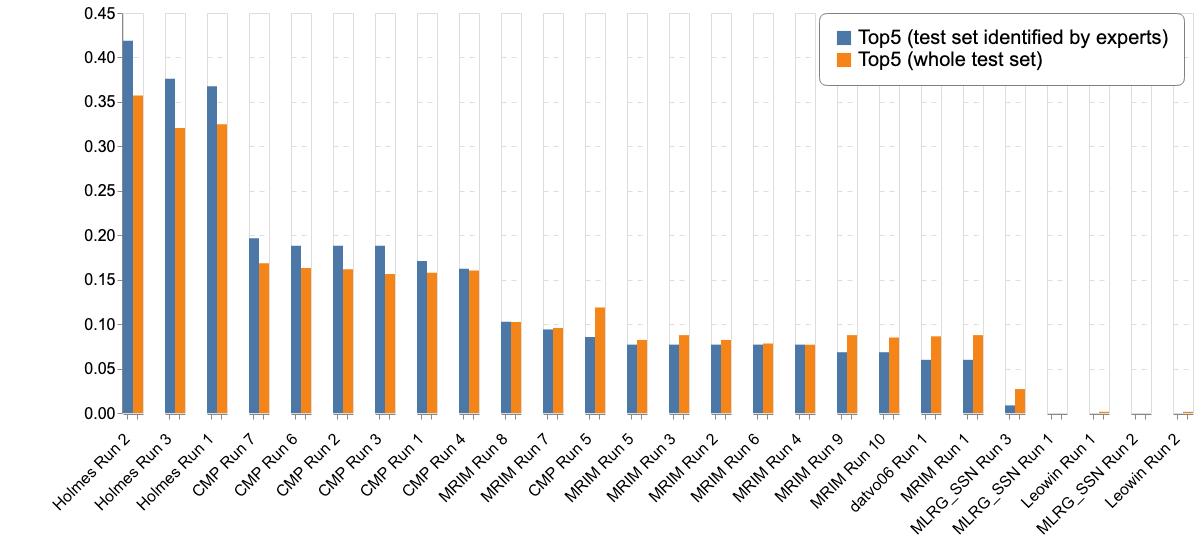
Complementary to the main metric, the next table and figures report the results according to different metrics (Top-3, Top-5, Mean Reciprocal Rank) :
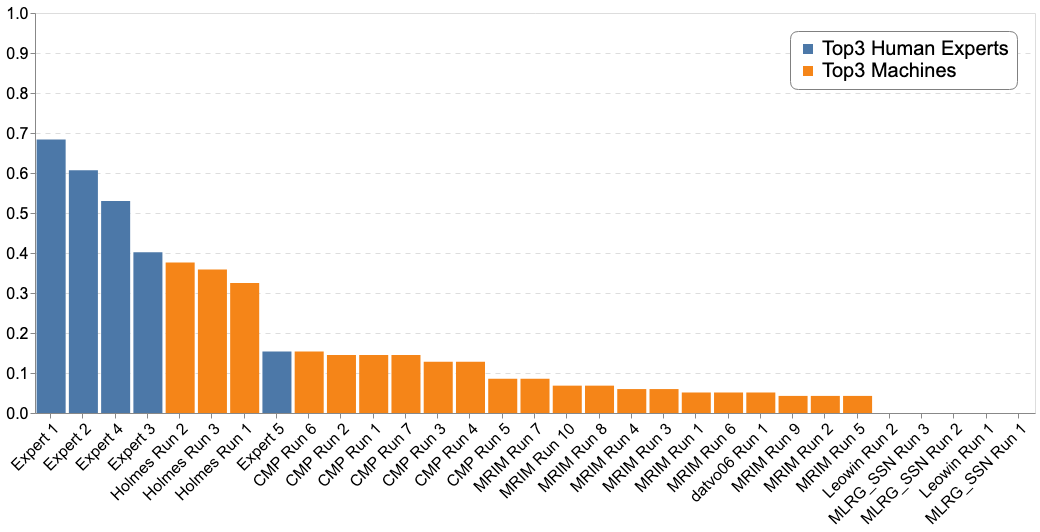
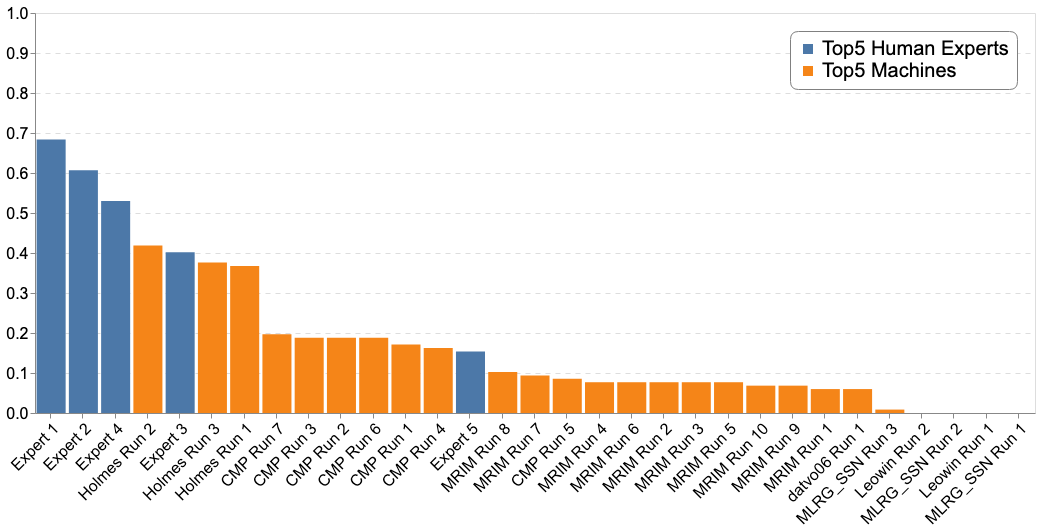
- the Top-3 accuracy allows a fair comparison between the machines and the experts. The humans could propose up to three species per plant while machines could propose up to one hundred. In spite of this the Top-5 accuracy is reported for both human experts and machine
- as a reminder the Mean Reciprocal Rank (MRR) is a statistic measure for evaluating any process that produces a list of possible responses to a sample of queries ordered by probability of correctness. The reciprocal rank of a query response is the multiplicative inverse of the rank of the first correct answer. The MRR is the average of the reciprocal ranks for the whole test set:
where |Q| is the total number of plant occurrences in the test set.

| Team run | Top1 (test set identified by experts) | Top1 (whole test set) | Top3 (test set identified by experts) | Top5 (test set identified by experts) | Top5 (whole test set) | MRR (test set identified by experts) | MRR (whole test set) | ||||||||||||||||||||||||||||||||||||||||||||||||||||||||||||||||||||||||||||||||||||||||||||||||||||||||||||||||||||||||||||||||||||||||||||||||||||||||||||||||||||||||||||||||||||||||||||||||||||||||||||||||||||||||||||||||||||||||||||||||||
|---|---|---|---|---|---|---|---|---|---|---|---|---|---|---|---|---|---|---|---|---|---|---|---|---|---|---|---|---|---|---|---|---|---|---|---|---|---|---|---|---|---|---|---|---|---|---|---|---|---|---|---|---|---|---|---|---|---|---|---|---|---|---|---|---|---|---|---|---|---|---|---|---|---|---|---|---|---|---|---|---|---|---|---|---|---|---|---|---|---|---|---|---|---|---|---|---|---|---|---|---|---|---|---|---|---|---|---|---|---|---|---|---|---|---|---|---|---|---|---|---|---|---|---|---|---|---|---|---|---|---|---|---|---|---|---|---|---|---|---|---|---|---|---|---|---|---|---|---|---|---|---|---|---|---|---|---|---|---|---|---|---|---|---|---|---|---|---|---|---|---|---|---|---|---|---|---|---|---|---|---|---|---|---|---|---|---|---|---|---|---|---|---|---|---|---|---|---|---|---|---|---|---|---|---|---|---|---|---|---|---|---|---|---|---|---|---|---|---|---|---|---|---|---|---|---|---|---|---|---|---|---|---|---|---|---|---|---|---|---|---|---|---|---|---|---|---|---|---|---|
| Holmes Run 2 | 0,316 | 0,247 | 0,376 | 0,419 | 0,357 | 0,362 | 0,298
| Holmes Run 3 |
0,282 |
0,225 |
0,359 |
0,376 |
0,321 |
0,329 |
0,274
| Holmes Run 1 |
0,248 |
0,222 |
0,325 |
0,368 |
0,325 |
0,302 |
0,269
| CMP Run 7 |
0,085 |
0,078 |
0,145 |
0,197 |
0,168 |
0,124 |
0,111
| CMP Run 2 |
0,077 |
0,061 |
0,145 |
0,188 |
0,162 |
0,117 |
0,097
| CMP Run 6 |
0,068 |
0,057 |
0,154 |
0,188 |
0,163 |
0,112 |
0,096
| CMP Run 1 |
0,068 |
0,069 |
0,145 |
0,171 |
0,158 |
0,107 |
0,099
| CMP Run 3 |
0,068 |
0,066 |
0,128 |
0,188 |
0,156 |
0,110 |
0,099
| CMP Run 4 |
0,060 |
0,053 |
0,128 |
0,162 |
0,160 |
0,097 |
0,090
| MRIM Run 1 |
0,043 |
0,042 |
0,051 |
0,060 |
0,088 |
0,055 |
0,063
| MRIM Run 8 |
0,034 |
0,046 |
0,068 |
0,103 |
0,102 |
0,057 |
0,068
| MRIM Run 7 |
0,026 |
0,042 |
0,085 |
0,094 |
0,096 |
0,053 |
0,065
| datvo06 Run 1 |
0,026 |
0,043 |
0,051 |
0,060 |
0,086 |
0,041 |
0,061
| CMP Run 5 |
0,026 |
0,054 |
0,085 |
0,085 |
0,119 |
0,050 |
0,078
| MRIM Run 10 |
0,026 |
0,034 |
0,068 |
0,068 |
0,085 |
0,047 |
0,057
| MRIM Run 5 |
0,017 |
0,036 |
0,043 |
0,077 |
0,082 |
0,039 |
0,058
| MRIM Run 3 |
0,017 |
0,030 |
0,060 |
0,077 |
0,088 |
0,043 |
0,054
| MRIM Run 2 |
0,017 |
0,036 |
0,043 |
0,077 |
0,082 |
0,039 |
0,058
| MRIM Run 6 |
0,017 |
0,028 |
0,051 |
0,077 |
0,078 |
0,037 |
0,049
| MRIM Run 9 |
0,017 |
0,031 |
0,043 |
0,068 |
0,088 |
0,039 |
0,055
| MRIM Run 4 |
0,009 |
0,027 |
0,060 |
0,077 |
0,077 |
0,038 |
0,049
| MLRG_SSN Run 1 |
0,000 |
0,000 |
0,000 |
0,000 |
0,000 |
0,000 |
0,000
| Leowin Run 1 |
0,000 |
0,000 |
0,000 |
0,000 |
0,001 |
0,000 |
0,000
| MLRG_SSN Run 2 |
0,000 |
0,000 |
0,000 |
0,000 |
0,000 |
0,000 |
0,000
| MLRG_SSN Run 3 |
0,000 |
0,012 |
0,000 |
0,009 |
0,027 |
0,004 |
0,021 |
-
| Leowin Run 2 |
0,000 |
0,000 |
0,000 |
0,000 |
0,001 |
0,000 |
0,000 |
-
| Expert 1 |
0,675 |
- |
684 |
0,684 |
- |
0,679 |
-
| Expert 2 |
0,598 |
- |
0,607 |
0,607 |
- |
0,603 |
-
| Expert 3 |
0,376 |
- |
0,402 |
0,684 |
- |
0,402 |
-
| Expert 4 |
0,325 |
- |
0,530 |
0,530 |
- |
0,425 |
-
| Expert 5 |
0,154 |
- |
0,154 |
0,154 |
- |
0,154 |
-
| |
The graphs below report the "machines" results only with the 3 different metrics :

The graphs below report the results of "machines" vs the humain experts according to the Top-1, Top-3 and Top-5 accuracies:
Late submission out of the official evaluation campaign
The CMP team encountered a bug when creating the run files. Here are the results that the team could have obtained with their methods explained in their working note. Officially the Holmes team remains the winning team of the challenge.
| Attachment | Size |
|---|---|
| 476 bytes | |
| 67.86 KB | |
| 58.79 KB | |
| 65.15 KB | |
| 66.56 KB | |
| 67.67 KB | |
| 66.89 KB | |
| 59.96 KB | |
| 58.98 KB | |
| 86.12 KB | |
| 86.77 KB | |
| 282.79 KB |